
Contents (11)
- What is the Williams %R indicator?
- Supertrend and the Awesome Oscillator in simple words
- Setting up the indicators
- The main rule: trade the step back
- 12 trades in one session, 5 explained step by step
- Watch the full video
- When I don’t trade with this strategy
- Is this strategy 100% accurate?
- Common mistakes
- Frequently asked questions
- The short version
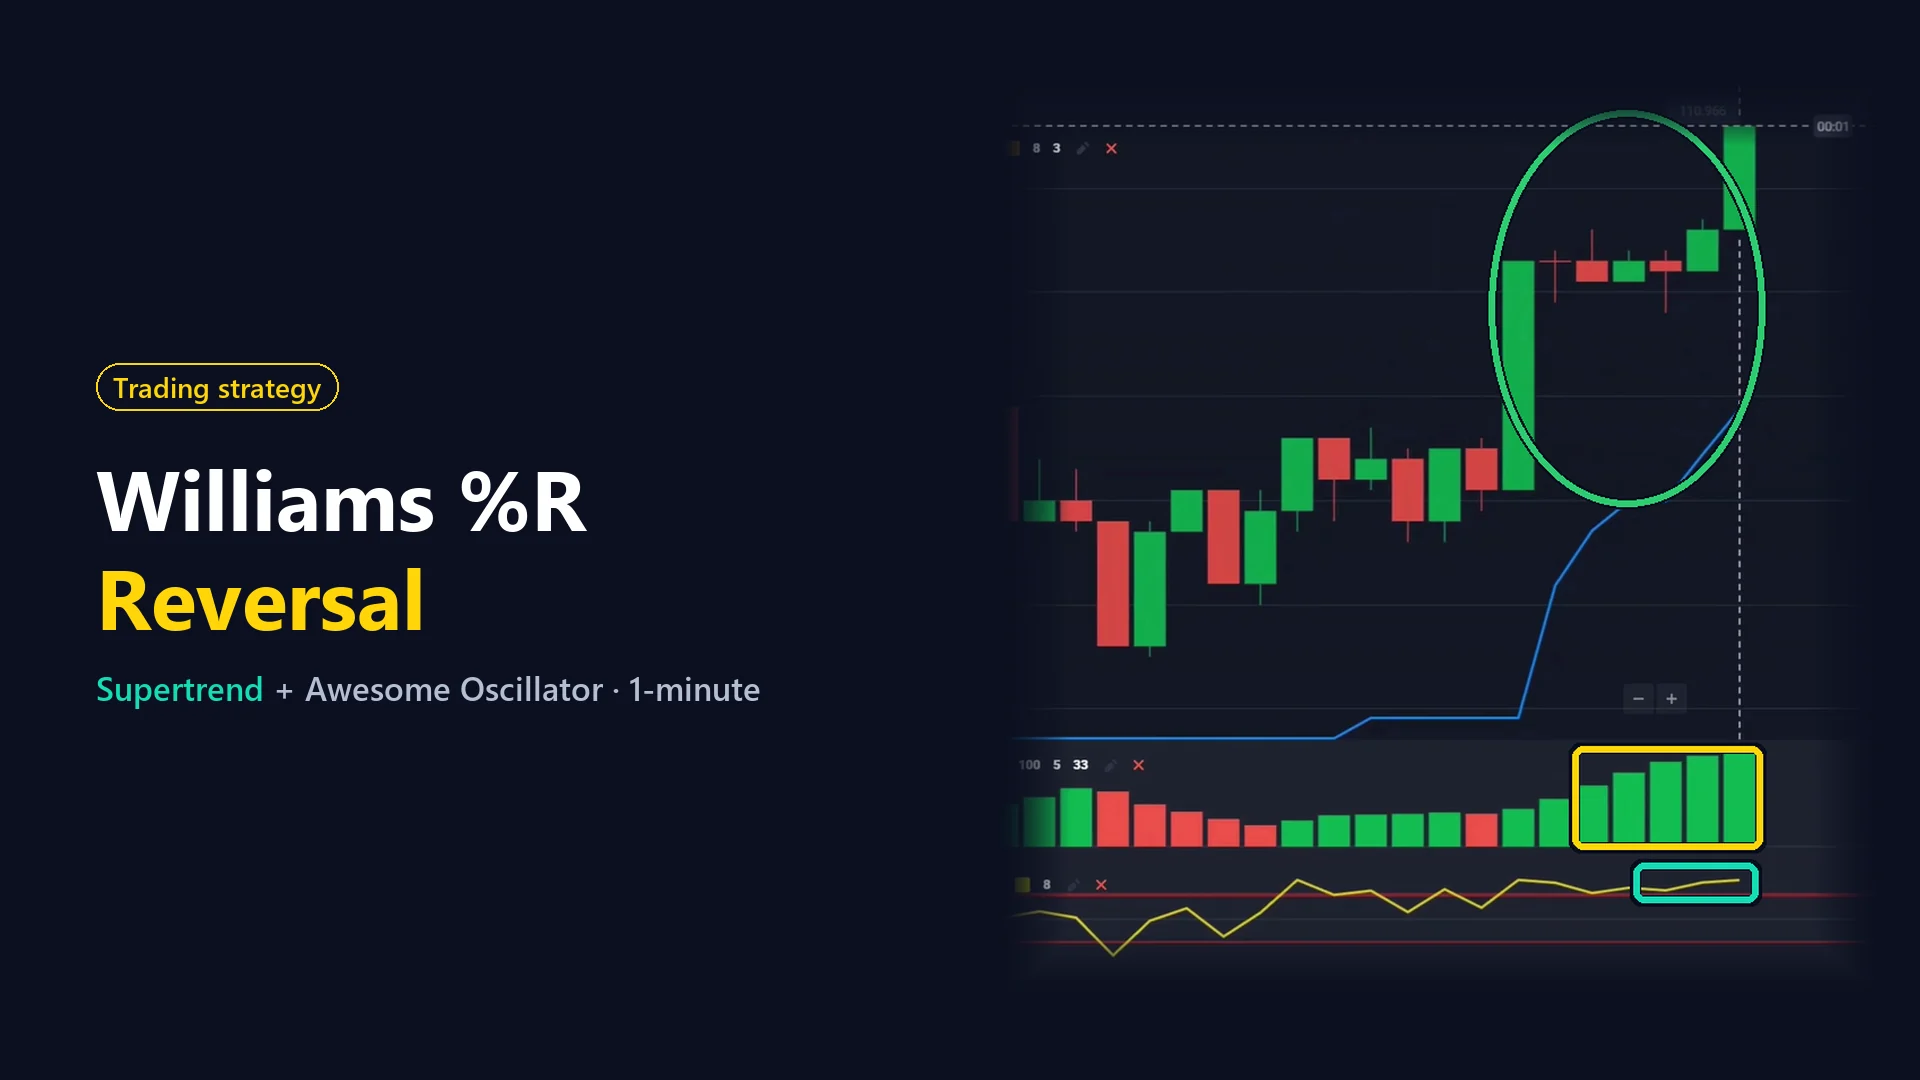
When the price shoots up, most people want to jump in and buy. But the price can’t go up forever. In this method I do the opposite: I wait until a fast move goes too far, and then I trade the small step back. I use three indicators, Williams %R, the Awesome Oscillator and Supertrend, on 10-second candles, and every position is open for 1 minute.
Below I explain each indicator in simple words, my settings and the exact rule. Then I show you the session from my video: 12 trades, and I go through 5 of them screenshot by screenshot, three down and two up. All 12 closed in profit that day, but that is one good session, not a promise.
What is the Williams %R indicator?
Williams %R (Williams Percent Range) was created by the trader Larry Williams. It shows where the latest closing price is compared to the highest and the lowest price of the last few candles.
- The line moves between 0 at the top and -100 at the bottom.
- At 0 the candle closed at the highest price of the period. At -100 it closed at the lowest price.
- Above -20 is the zone many traders call overbought, below -80 the oversold zone.
- A shorter period makes the line faster, so it reaches the edges more often.
In my colors the main line is yellow and the -20 and -80 levels are red. For me, Williams %R is the indicator that shows when the price has gone too far. And I am strict about it: being above -20 or below -80 is not enough. The yellow line has to touch the very edge, 0 for a position down or -100 for a position up.
Supertrend and the Awesome Oscillator in simple words
Supertrend is a line that follows the price at a safe distance. The distance comes from the Average True Range, which measures how big the candles have been lately, multiplied by a number (the multiplier).
- In my setup a blue line under the candles means the price has been going up.
- An orange line above the candles means the price has been going down.
- When the price closes on the other side of the line, it changes color and jumps to the other side.
The Awesome Oscillator was created by Bill Williams, and I also use it in my Donchian Channel strategy. It compares a short average of the price with a long one and shows the result as bars around a zero line. Bars above zero mean the short-term push is up, bars below zero mean it is down. A green bar is simply taller than the one before it, a red bar is shorter.
Put simply: Williams %R shows that the price has gone too far, and the Awesome Oscillator and Supertrend show that the old move is still in place. That is exactly the moment I want, a stretched move that hasn’t turned yet.
Setting up the indicators
First, the Awesome Oscillator. I keep the short period at 5 and change the long period to 33 (the default is 34). I don’t change the colors.
The second indicator is Williams %R. I lower the period to 8 (the default is 14), choose yellow for the main line, and thicken all the lines.
The last one is Supertrend. I set the period to 8 and leave the multiplier at 3. I choose blue and orange, and thicken both lines.
Then I set 10-second Japanese candles and change the trading time to 1 minute.
| Indicator / setting | Value | Color |
|---|---|---|
| Awesome Oscillator | 5 and 33 | Default green and red bars |
| Williams %R | Period 8 | Main line yellow, -20 and -80 levels red, thick lines |
| Supertrend | Period 8, multiplier 3 | Blue and orange, thick lines |
| Candles | 10 seconds | |
| Trade duration | 1 minute |
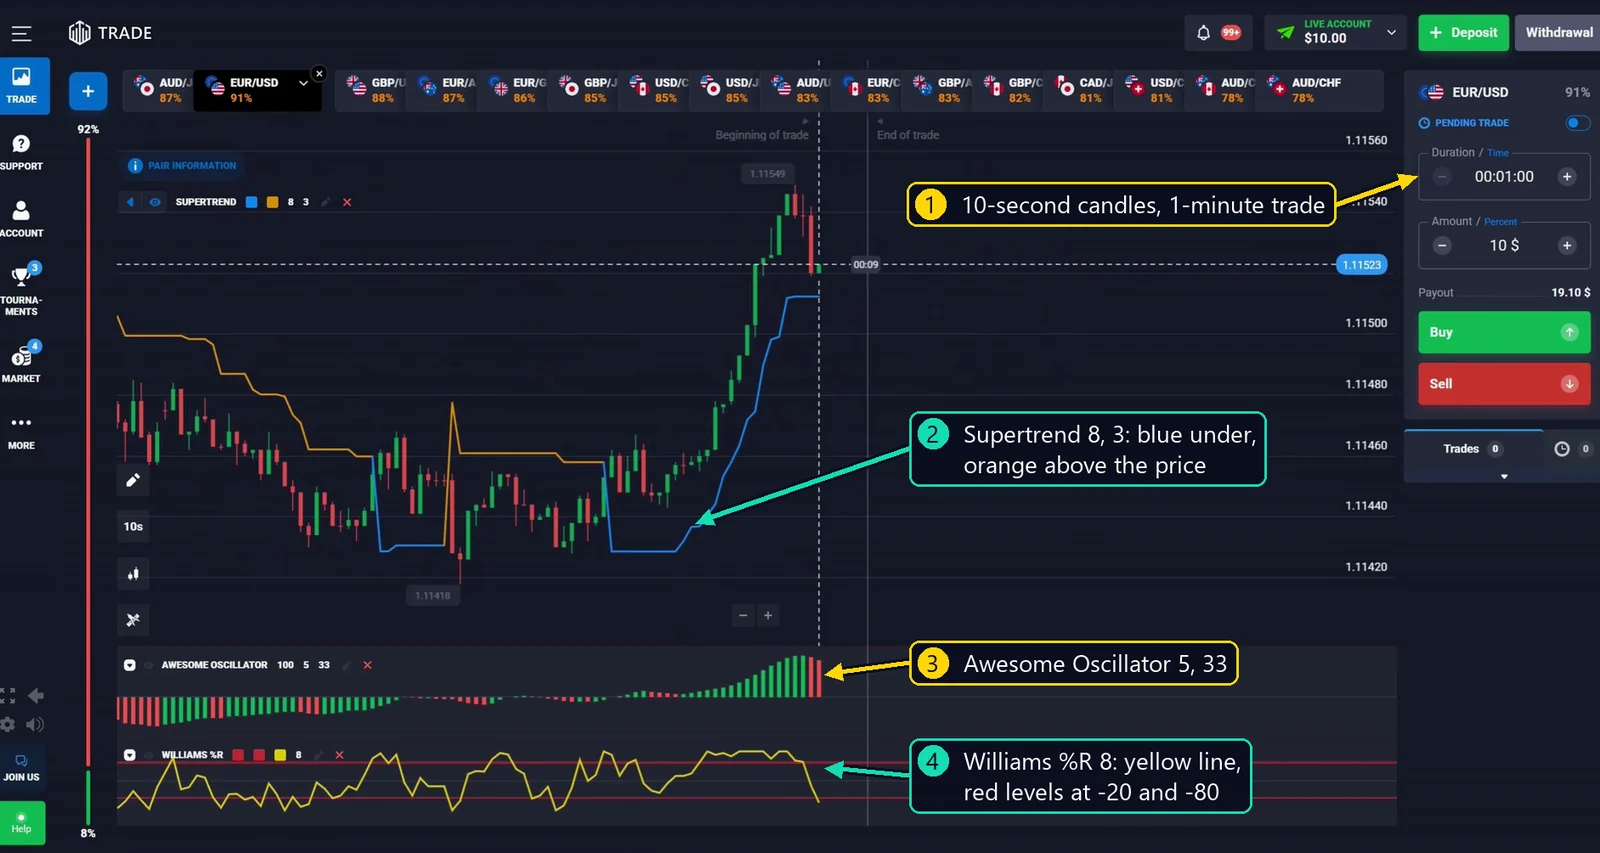
Next, I add several currency pairs with a high payout, so I can quickly switch between them and look for a moment on each one. A good moment doesn’t come on every pair at the same time.
The main rule: trade the step back
I’m looking for a fast move that has gone too far, and then all three indicators must agree on the same candle. For a position down:
- Williams %R: the yellow line touches the very top, 0.
- Awesome Oscillator: the bars are above zero. Their color doesn’t matter.
- Supertrend: the line is still blue, under the candles.
For a position up, everything is the other way around: Williams %R at the very bottom (-100), the Awesome Oscillator bars below zero, and the Supertrend line orange, above the candles. When all three are in place, I open the position when the candle closes, for 1 minute.
Why I go against the fast move
On 10-second candles, one minute is only six candles. So I don’t need a big turn, just a small step back. Every candle is a small fight between buyers and sellers, and after a fast run one side often runs out of strength for a moment.
When the signals say no
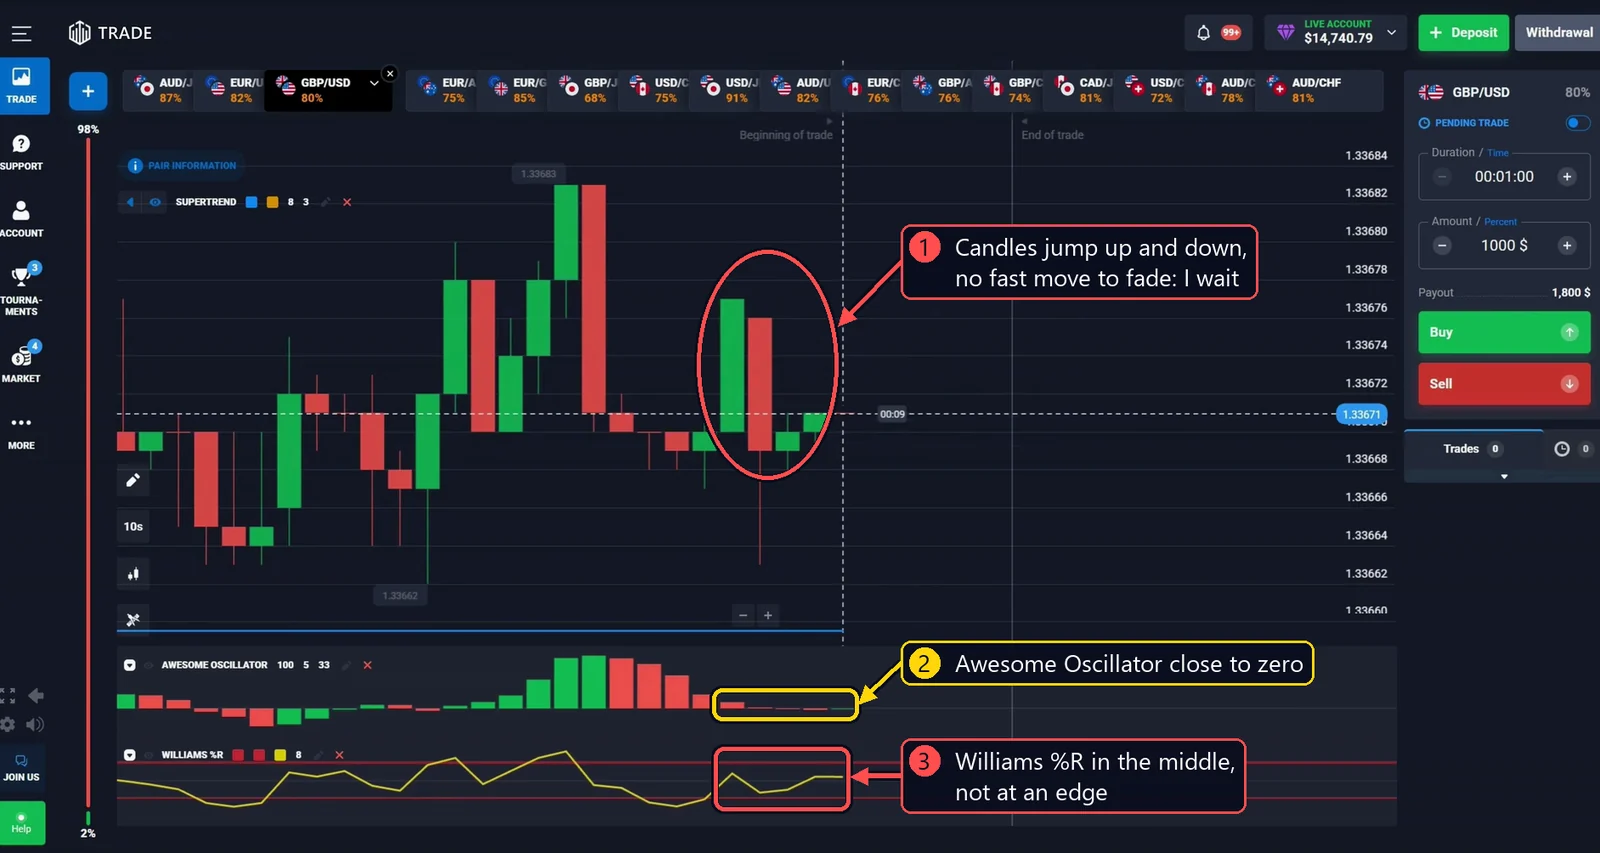
Here is a moment from the end of the same session. The candles are big, but there is no clean fast move, and nothing is stretched.
- The candles jump up and down instead of running in one direction.
- The Awesome Oscillator bars are almost at zero.
- The Williams %R line is in the middle, far from both edges.
Quick checklist
| Position down | Position up | |
|---|---|---|
| Before | Fast move up | Fast or long move down |
| Williams %R | Yellow line touches 0 | Yellow line touches -100 |
| Awesome Oscillator | Bars above zero | Bars below zero |
| Supertrend | Still blue, under the candles | Still orange, above the candles |
| Avoid | Williams %R only close to the edge, entering before the candle closes, choppy candles | |
| Duration | 1 minute | 1 minute |
12 trades in one session, 5 explained step by step
Here is the whole session. Every trade lasted 1 minute, and some of the later ones were split into several positions at the same moment.
| # | Pair | Direction | Payout | Result |
|---|---|---|---|---|
| 1 | AUD/JPY | Down | 85% | Win |
| 2 | GBP/JPY | Down | 81% | Win |
| 3 | AUD/USD | Down | 87% | Win |
| 4 | AUD/CHF | Down | 84% | Win |
| 5 | CAD/JPY | Down | 83% | Win |
| 6 | USD/JPY | Up | 86% | Win |
| 7 | GBP/USD | Up | 87% | Win |
| 8 | EUR/GBP | Up | 85% | Win |
| 9 | USD/JPY | Down (2 positions) | 84% | Win |
| 10 | AUD/JPY | Up (3 positions) | 87% | Win |
| 11 | CAD/JPY | Down (5 positions) | 81% | Win |
| 12 | GBP/USD | Down (8 positions) | 80% | Win |
I picked 5 trades that show the different faces of the same rule. Each screenshot was taken at the moment of entry, right before I clicked the button. The numbers on the arrows match the explanation under the picture.
Trade 1: AUD/JPY, down after a fast climb
In the video: 1:34 · Payout 85%
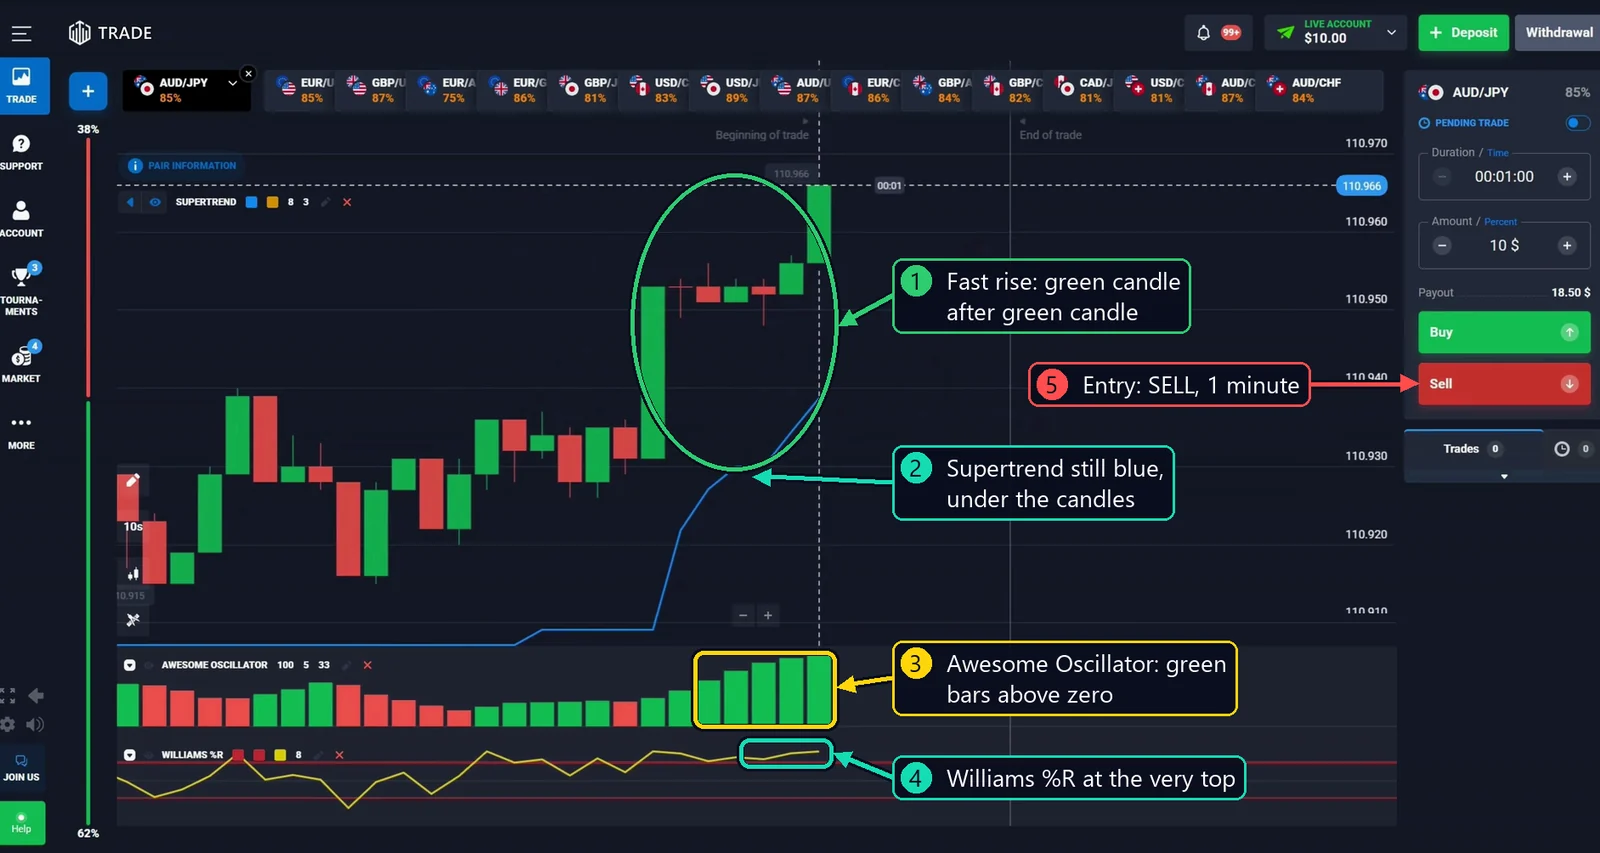
Why I entered:
- The price went up very fast, green candle after green candle.
- The Supertrend line is still blue under the candles.
- The Awesome Oscillator bars are green and above zero.
- The yellow Williams %R line is at the very top.
- All three show this together, so the move has gone too far. I open a position down for 1 minute.
Result: at first the price didn’t listen to me, and the candles kept climbing above my entry line. Then came a red candle, then another one, and the price moved below my line. The buyers suddenly ran out of strength. The first trade closed with a win.
Trade 3: AUD/USD, down against a very strong move
In the video: 3:22 · Payout 87%
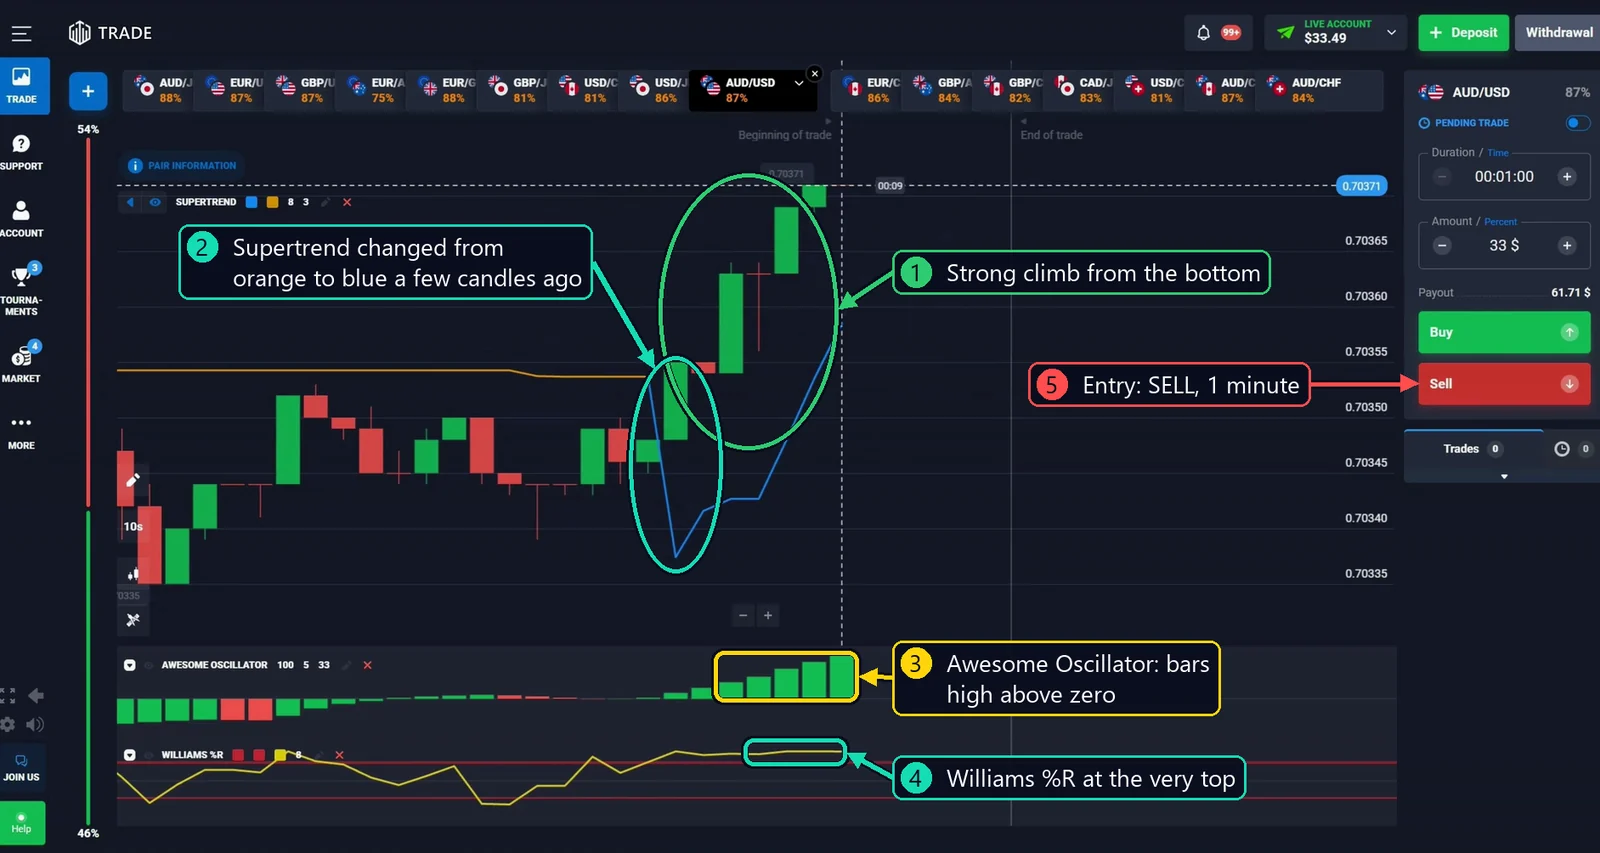
Why I entered:
- The price came up from the very bottom with big green candles.
- A few candles ago the Supertrend line changed from orange to blue. Many people would buy here without thinking.
- But the Awesome Oscillator bars are high above zero.
- And the Williams %R line is at the top. For me this move has gone too far.
- I open a position down for 1 minute.
Result: the price kept creeping up, but slowly now, with smaller candles. Those small candles were a warning. When a fast move turns into a slow one, the buyers can be running out of strength. Then the red candles came, the price went under my line, and the position closed in profit.
Trade 5: CAD/JPY, one huge green candle is enough
In the video: 5:14 · Payout 83%
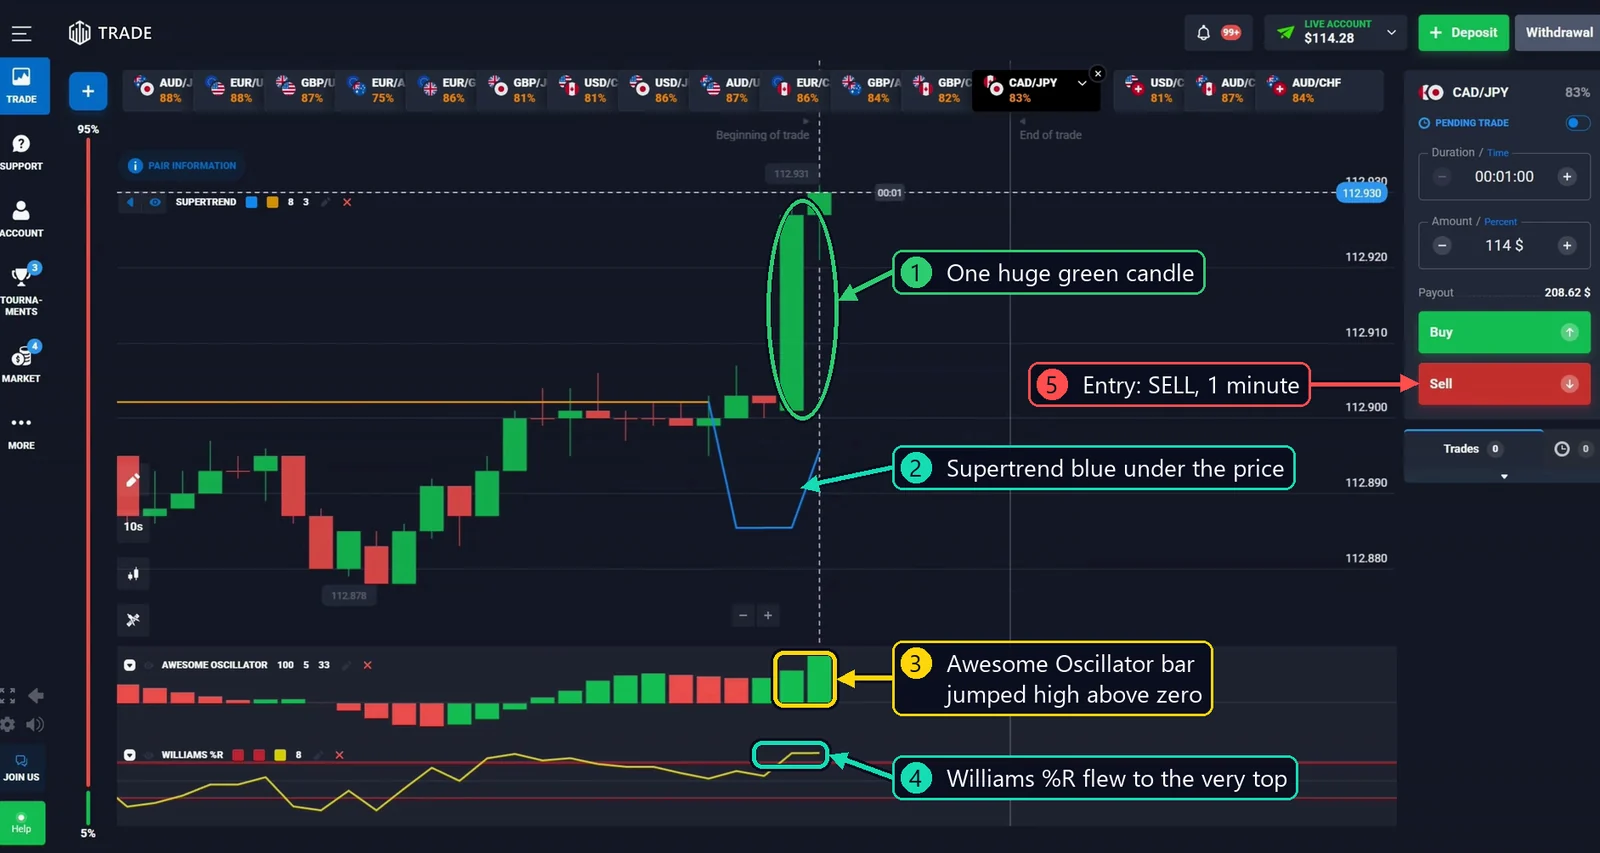
This time there was no long climb, just one huge green candle.
Why I entered:
- One big candle shot the price up.
- Supertrend is blue under the price.
- The Awesome Oscillator bar grew high above zero.
- The Williams %R line flew straight to the top.
- One big candle like this can be enough when all three signs are there. I open a position down for 1 minute.
Result: for a while the price stood still right at my entry line, not up, not down. Then came the red candle I was hoping for, and the price slid lower. The fifth win in a row.
Trade 6: USD/JPY, up after a fast fall
In the video: 6:12 · Payout 86%
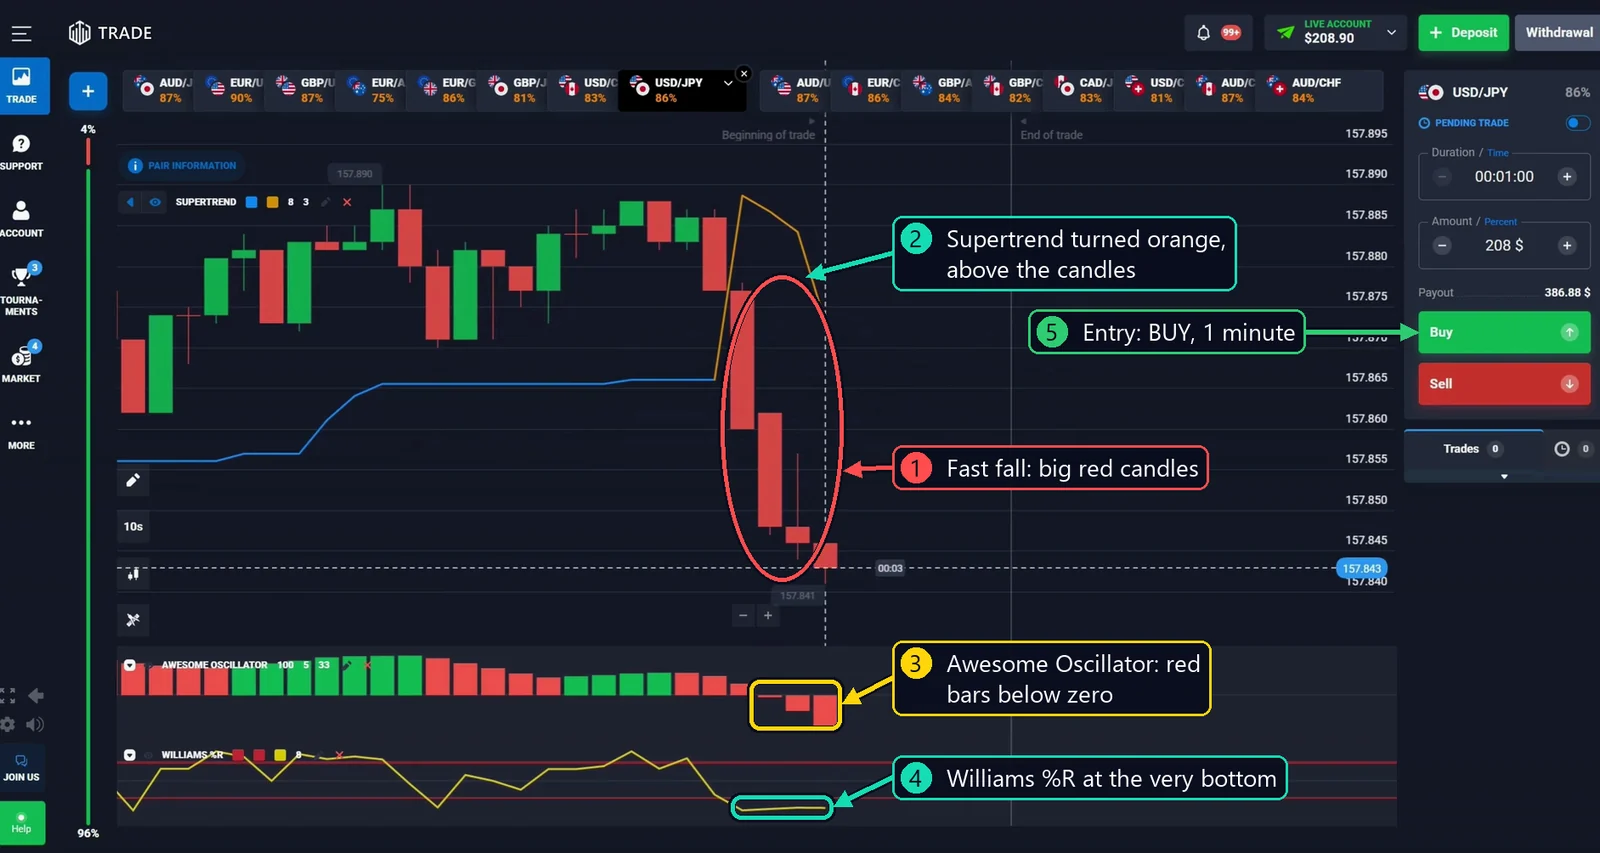
So far every position was down. But the same rule works the other way too, and here the market gave me that moment.
Why I entered:
- The price fell very fast with big red candles.
- The Supertrend line is orange, above the candles. It turned orange just a few candles ago, after this fall.
- The Awesome Oscillator bars are red and below zero.
- The yellow Williams %R line has dropped to the very bottom.
- I open a position up for 1 minute.
Result: the first seconds were quiet. The candles stayed flat, right on my line, as if the market was thinking. Then a green candle, another one, and the price lifted above my entry. The sellers pushed really hard and had nothing left. The first up position also won.
Trade 7: GBP/USD, up after a slow fall
In the video: 7:08 · Payout 87%
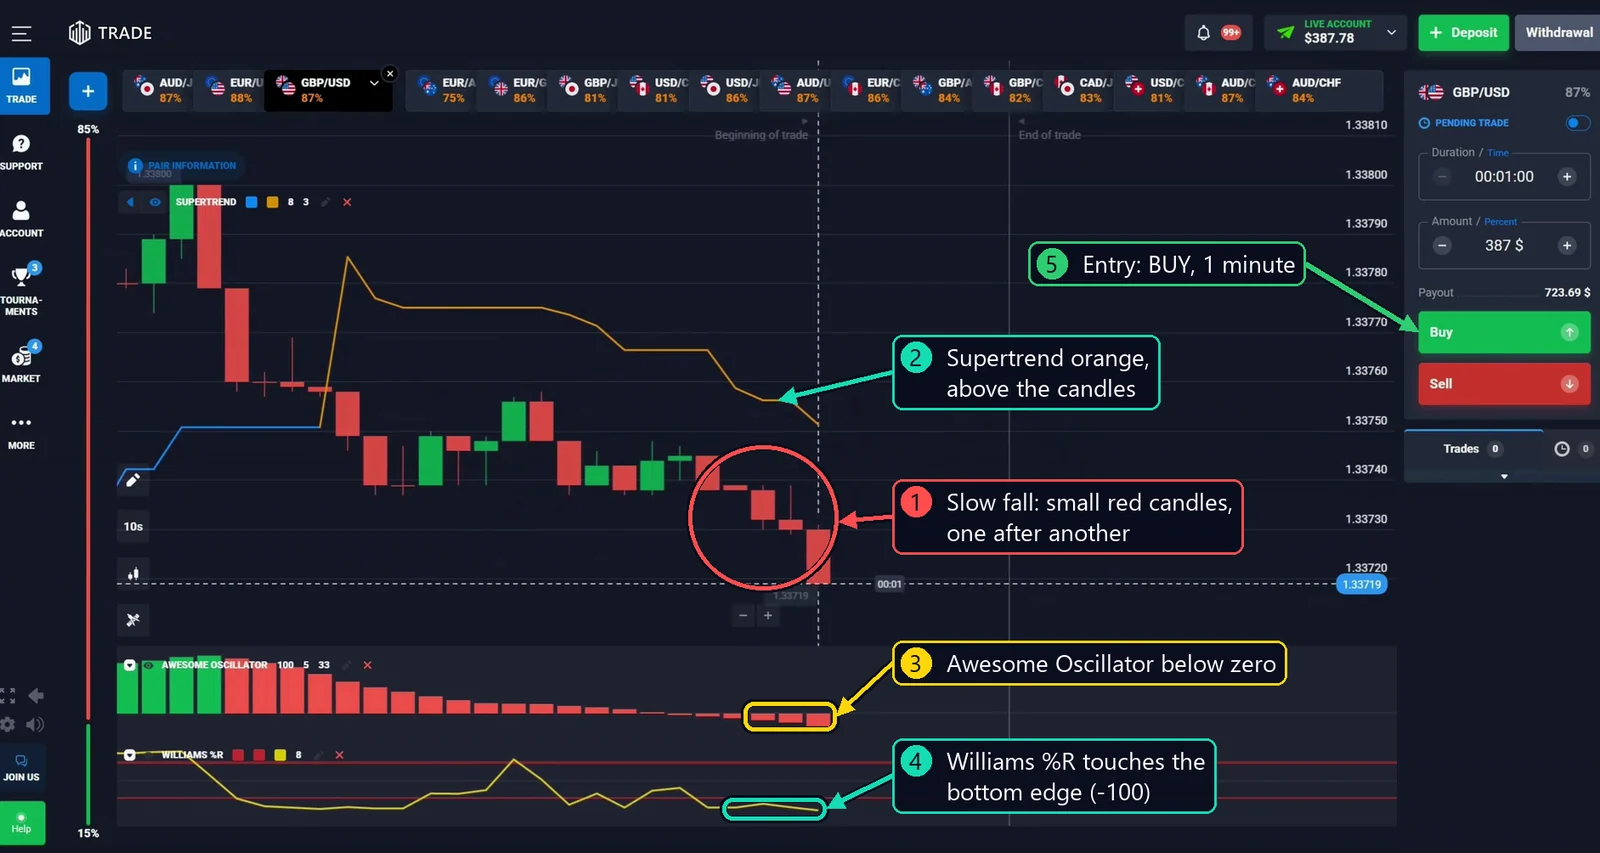
This fall was not fast like the last one. The rule doesn’t ask for a crash. It asks for the Williams %R line to touch the bottom edge.
Why I entered:
- The price went down slowly, one small red candle after another.
- The candles are under the orange Supertrend line.
- The Awesome Oscillator bars are below zero.
- The Williams %R line touches the bottom edge, -100.
- I open a position up for 1 minute.
Result: a green candle came right after my entry, a nice start. Then the price moved around my line, a little above it. Small up, small down, nobody in a hurry. It stayed above my entry until the end, another clean win.
Watch the full video
When I don’t trade with this strategy
The hardest part of this method is waiting. Most mistakes come a few seconds too early. I skip the moment when:
- the yellow Williams %R line is only above -20 or below -80, but doesn’t touch 0 or -100,
- the Awesome Oscillator or Supertrend has already turned in the direction I want to trade,
- the candle hasn’t closed yet,
- the candles jump up and down with no clear move before them.
Is this strategy 100% accurate?
No. No method wins every time, and losses are part of trading. Twelve out of twelve is my result from one session, not a promise.
It helps to know your numbers. With a payout of 87%, you need to win about 54 trades out of 100 just to break even. With 80%, you need about 56. You can check this for your own payout with my break-even win rate calculator.
And I want to be honest with you about the balance. In this session I put almost my whole balance into every trade. That is very risky, even if it looks exciting. One loss, and it would all be gone. Please don’t copy this with money you can’t afford to lose. Risk only a small part of your balance on a single trade, test the strategy on a demo account first and keep a trading journal.
Common mistakes
- Entering a few seconds too early. Wait until the candle closes with all three signs in place.
- Taking “close” as enough. If the Williams %R line is near the edge but doesn’t touch it, I don’t open.
- Following the fast move. In this method a strong move is the setup for the opposite position, not a reason to join it.
- Worrying when Supertrend changes after the entry. In trade 10 it turned from orange to blue right after I opened, and that was fine. Supertrend only matters at the second I open the position. After that I just watch the price and the time.
- Feeling too sure after a few wins. After three wins in a row, many people get overconfident, and that feeling is dangerous. I look at every trade as the first one, with a calm head and the same rules.
Frequently asked questions
What is the best Williams %R setting for a 1-minute strategy?
The default period is 14. On 10-second candles I lower it to 8, so the line reacts fast enough to reach the edges after a short burst. I only count a signal when the yellow line touches 0 or -100.
What is the difference between Williams %R and RSI?
RSI compares the size of the recent up moves with the recent down moves and runs from 0 to 100. Williams %R only looks at where the last close sits between the highest and lowest price of the period, from 0 to -100. That makes Williams %R faster and more jumpy, which is useful when I want to see the very edge of a short move.
Why do I trade against Supertrend?
Here Supertrend is not my direction. It is my check that the old move is still in place. A blue line under a fast climb, together with Williams %R at the top, tells me the move is stretched but hasn’t turned yet. My trade only lasts 1 minute, so I am betting on the small step back, not on a new trend.
Why 10-second candles with a 1-minute trade?
On 10-second candles a fast move and its first pause are easy to see. One minute is six of these candles, which is enough time for a small step back and short enough that the bigger trend doesn’t take over.
What happens if the price ends exactly at my entry?
If at the end the price is exactly on my entry line, it’s neither a win nor a loss. The money simply comes back. So in the last seconds, my line is the only thing that matters.
The short version
Wait for a fast move. For a position down, the Williams %R line touches 0, the Awesome Oscillator bars are above zero and Supertrend is still blue under the candles. For a position up, the Williams %R line touches -100, the bars are below zero and Supertrend is still orange above the candles. When all three agree on the same closed candle, open for 1 minute. When one sign is missing, skip it and wait.
If you prefer a 1-minute method that follows the trend, try my 1 minute scalping strategy or the Parabolic SAR and EMA crossover strategy. I wish you very, very successful trading days.
I’m Katie. I’ve been trading for more than seven years, and most of my own trading is short-term options like the trades above. More about me.
Remember: trading involves risk. This article is for educational purposes only and is not a recommendation to copy my actions. You alone are responsible for all of your trading decisions.