
Most people answer this question with their account balance, which is the one piece of evidence that cannot answer it over any short period. A good strategy loses for weeks and a bad one pays for weeks, and neither of those facts is visible while it is happening.
There is a way to answer it properly, and it takes five numbers and a lot more trades than you would like.
Why your profit and loss cannot tell you
The result of any individual trade is mostly noise. The result of twenty trades is mostly noise. This is not a motivational point, it is an arithmetic one, and it is covered in full in why trading is so hard.
The short version: to tell a genuine 55% win rate from a coin flip with reasonable confidence takes roughly 785 trades. So if you are judging a strategy on last month, you are reading tea leaves with extra steps.
What you can do in the meantime is measure the things that are stable much sooner than the balance is.
The five numbers that can tell you
Every one of these comes out of a trade record. None of them requires software, and none of them is the balance.
| Number | How you get it | What it tells you |
|---|---|---|
| Sample size | Count the trades of this exact strategy | Whether any of the others mean anything yet |
| Win rate | Winners ÷ total trades | Almost nothing on its own. Only useful beside the next row |
| Average win vs average loss | Mean winner ÷ mean loser, expressed as R | Whether the strategy pays enough when it is right |
| Expectancy | See below | The only number that says make or lose money |
| Worst losing streak | Longest run of losses so far | Whether your size can survive the strategy |
People obsess over the second row and ignore the fourth. A 70% win rate is worthless if the 30% of losses are four times the size of the wins, and a 35% win rate is excellent if the winners run.
Expectancy is the number that decides it
Expectancy is what one trade is worth on average, over many trades. The formula is short:
Expectancy = (win rate × average win) − (loss rate × average loss)
Suppose you win 40% of the time, your average winner is $200 and your average loser is $100. That gives (0.40 × 200) − (0.60 × 100), which is 80 − 60, so $20 per trade. Take a hundred of those and the strategy is worth $2,000 before you have done anything clever.
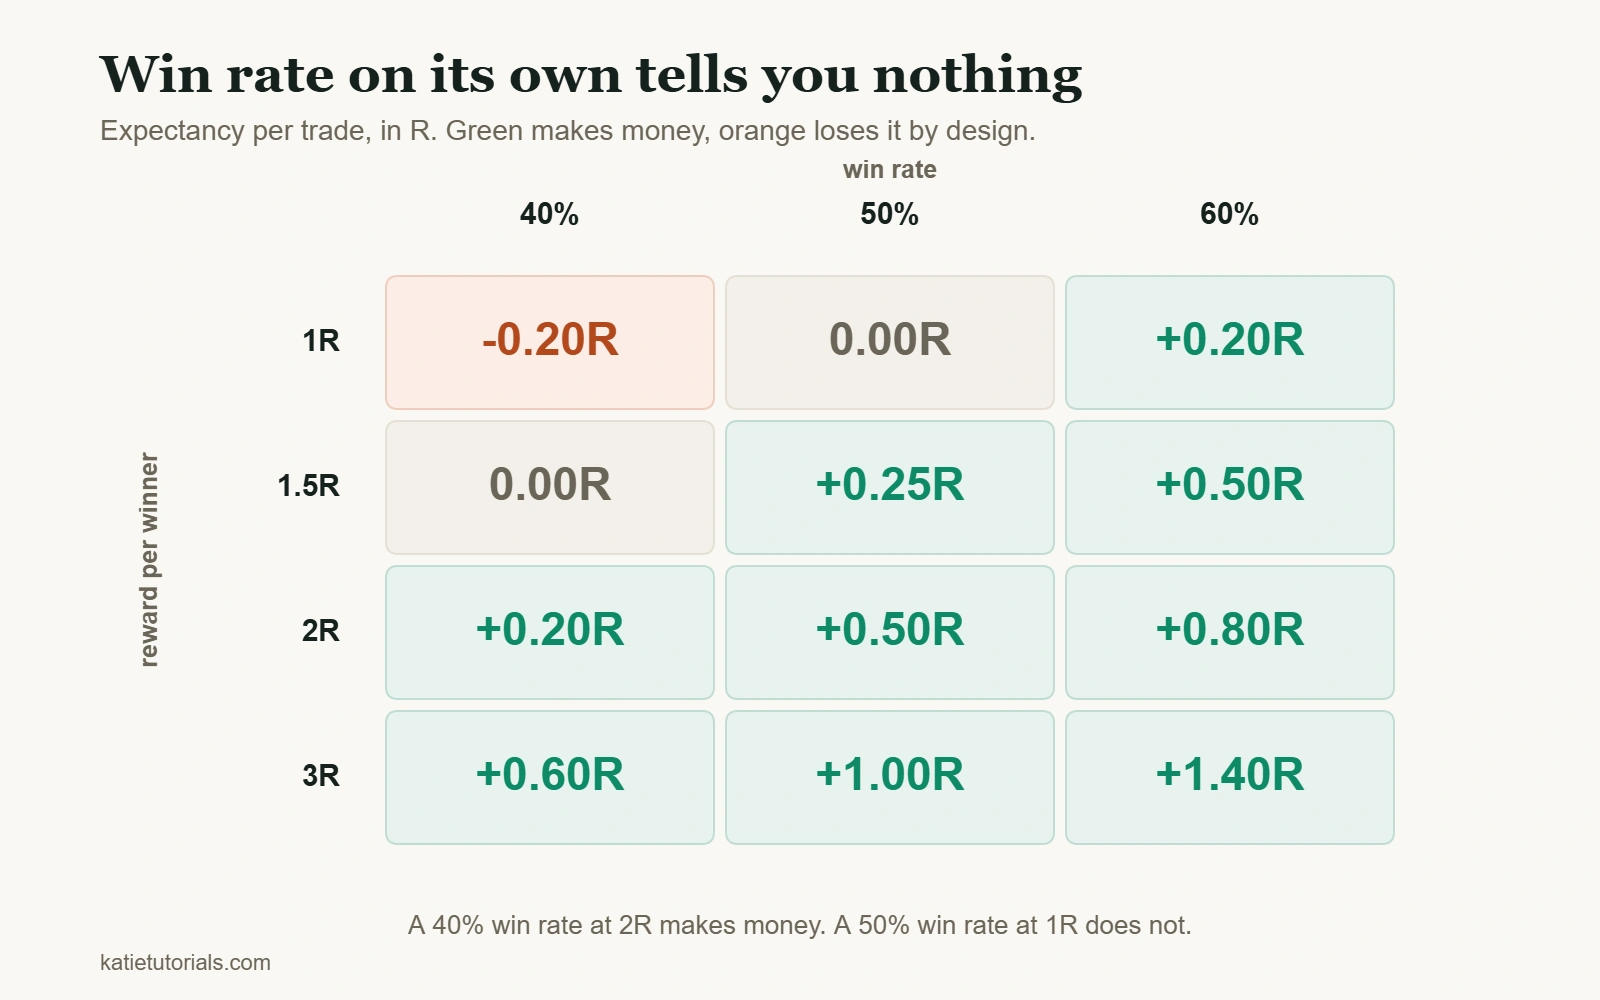
It is easier to read in R, where 1R is whatever you risk per trade. Here is expectancy per trade across the combinations people actually run:
| Reward per winner | Win rate 40% | Win rate 50% | Win rate 60% |
|---|---|---|---|
| 1R | −0.20R | 0.00R | +0.20R |
| 1.5R | 0.00R | +0.25R | +0.50R |
| 2R | +0.20R | +0.50R | +0.80R |
| 3R | +0.60R | +1.00R | +1.40R |
Two things fall out of that table. A 1R strategy needs to be right more than half the time just to break even, before costs, which is why scalping small targets is so much harder than it looks. And a 2R strategy at a 40% win rate makes money while being wrong three times out of five.
Anything at or below zero is not a strategy with a bad month. It is a strategy that loses money by design, and no amount of discipline will change that.
How many trades before you trust the answer
Expectancy computed on fifteen trades is a rumour. These are the rough sample sizes needed before the number stops moving around:
| Trades logged | What you can conclude |
|---|---|
| Under 20 | Nothing. Do not change anything based on this |
| 20 to 50 | Whether you are following the plan. Not whether the plan works |
| 50 to 100 | A first read on expectancy and on your worst streak. Treat it as provisional |
| 100 to 300 | A usable estimate, if conditions did not change underneath you |
| Several hundred | Enough to distinguish a modest edge from luck |
The awkward implication is that most retail traders never accumulate enough trades of any single approach to know whether it worked. They switch after every bad run, which resets the count to zero, and they do that for years.
Is it broken, or is this normal?
This is the question that actually gets asked, usually during a drawdown. There are ways to tell the two apart.
| What you are seeing | Probably normal variance | Probably broken |
|---|---|---|
| Five or six losses in a row | Yes. At a 45% win rate this happens to 92% of traders inside 100 trades | Only if the losses are bigger than your planned risk |
| A drawdown deeper than anything in your record | Possibly, if the record is short | Worth investigating once it is well past your worst historical streak |
| Win rate has fallen but R is unchanged | Likely variance | If it persists over 100+ trades, the setup may have stopped working |
| Losses are larger than intended | Not variance | Execution problem, not a strategy problem |
| The setups are getting harder to find | Market conditions changed | The strategy may suit a regime that has ended |
The row that matters most is the fourth. If your losses are bigger than the risk you planned, the strategy has not been tested at all yet, because what you ran was not the strategy.
Signs you never actually tested it
Before concluding a strategy does not work, rule these out, because all four are far more common than a genuinely broken method.
- You changed it during the test. Adjusting the rules mid sample means the sample is of nothing.
- You did not follow it. If the “did I follow my plan” column in your journal is mostly N, you have been testing your discipline, not your strategy.
- The rules were never specific enough to break. “Buy the pullback” is not a rule. “Buy the first close above the 20 EMA after two touches of the level” is.
- Position size moved around. If risk varied per trade, the results are not comparable and expectancy in R is meaningless.
What backtesting is worth
Testing a strategy on historical data is useful and it is routinely oversold. Here is the honest split.
What it gives you: a large sample quickly, a sense of the worst drawdown the approach would have suffered, and an early filter for ideas that never worked at all.
What it does not give you: the past has already happened, and you know how it ended. Every choice you make while testing is contaminated by that. Add enough rules and any historical period can be made profitable, which tells you nothing about the next one. You also cannot backtest your own behaviour, and the behaviour is usually the binding constraint.
The practical compromise is to use backtesting to reject ideas rather than to confirm them, and then to forward test the survivors at the smallest size your broker allows. A strategy that works on paper and falls apart in a live account is the normal outcome, not the exception.
Common questions
How do I know if my trading strategy works?
Compute expectancy from at least a hundred logged trades where you followed the rules and kept risk constant. If it is meaningfully above zero after costs, it works. If you cannot compute it because the record does not exist, that is the answer to a different and more urgent question.
What win rate should a good strategy have?
There is no such number, and asking it is the most common beginner error on this topic. Win rate is only meaningful next to your reward to risk. 35% is excellent at 3R and fatal at 1R.
How long should I test a strategy before giving up?
Count trades, not weeks. A hundred trades is a reasonable minimum for a first verdict, and the time that takes depends entirely on your frequency. The one rule is to decide the number before you start, because deciding it during a drawdown guarantees you stop at the worst moment.
Should I use more than one strategy?
Not until the first one has a few hundred logged trades. Running two halves your sample on each and doubles the chance you conclude nothing about either. Diversifying methods is something that makes sense once you have one that demonstrably works, not as a way of finding one.
The short version
Five numbers: how many trades, win rate, average win against average loss, expectancy, worst streak. The fourth is the verdict, the first decides whether the fourth means anything, and the balance is not on the list.
Most strategies that get abandoned were never tested. They were interrupted.