
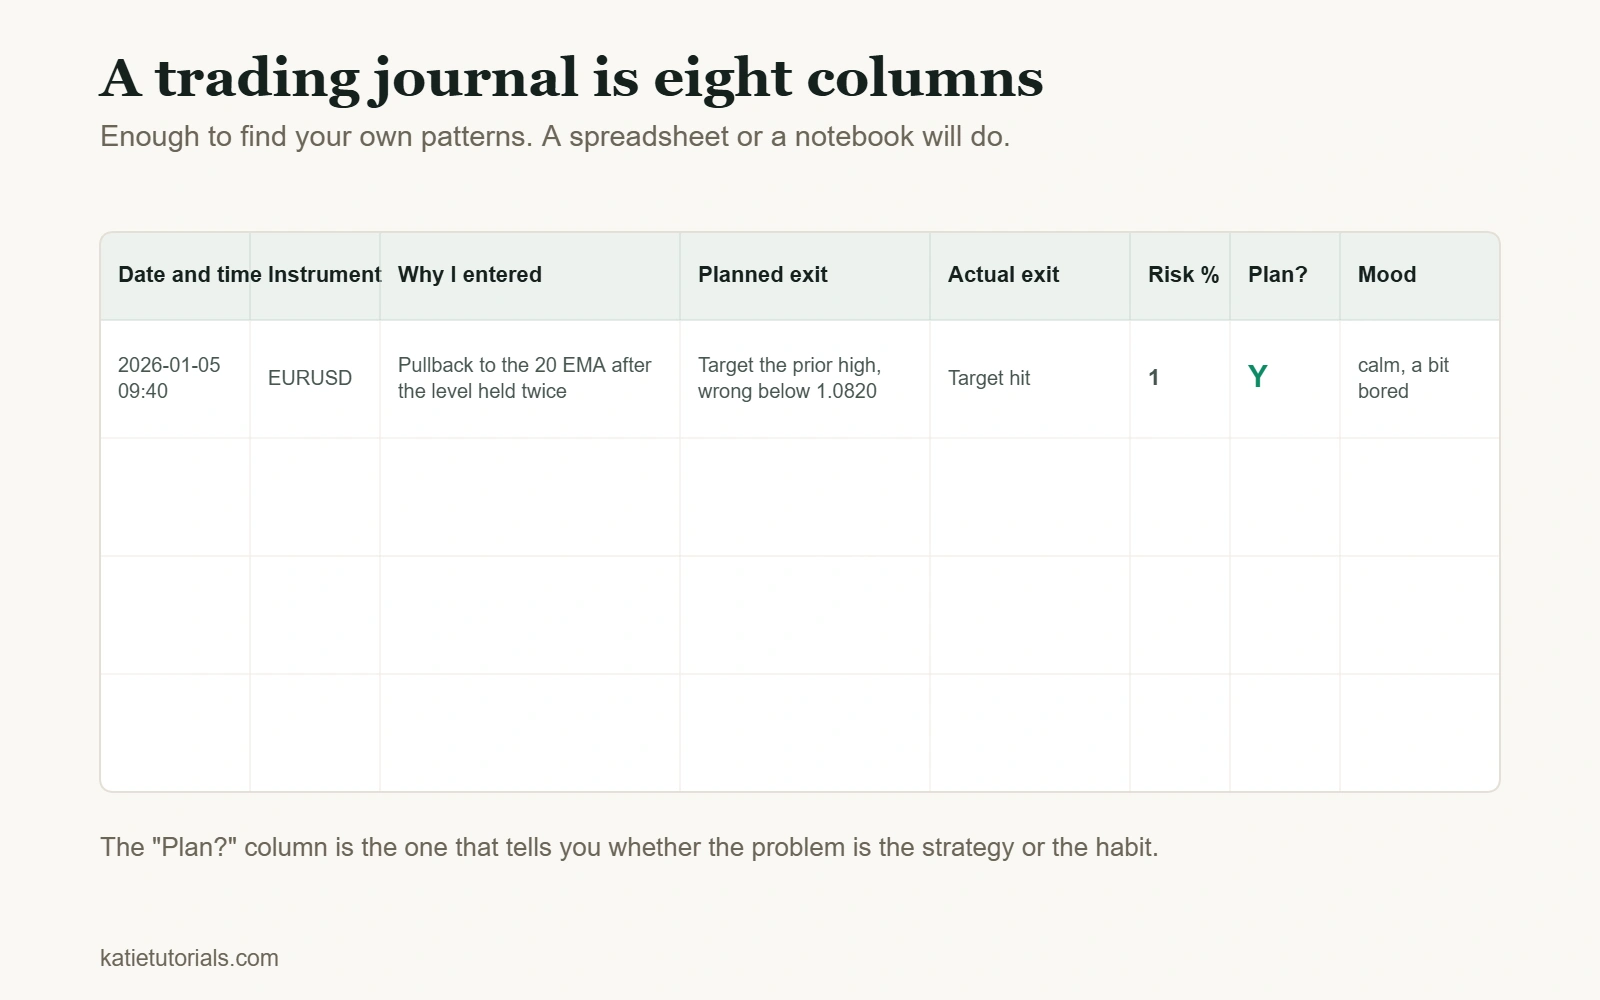
A trading journal is a record of the decision, not of the result. The profit and loss is already in your account statement and it tells you almost nothing. What the statement cannot tell you is why you entered, what you planned to do, and whether you actually did it.
The whole thing fits in eight columns. A notebook is enough to start. You do not need software, and the reason almost every article you will read says otherwise is that almost every article you will read was written by a company selling software.
What my journal showed me that memory never did
I always believed I remembered my own mistakes. Keeping a journal showed me a different reality.
When I finally sat down with the data, the losses were concentrated on Friday evenings, when I was tired and broke my own strategy without really noticing. I would never have found that by thinking hard about it. Memory does not keep an index by day of the week, and it quietly edits out the trades you would rather not think about.
The same records showed something I could use in the other direction. My Schaff Trend Cycle and MACD combination worked far better in some sessions than in others, which is not something you can feel, only count.
I do not open a trade without the journal now. It is the most objective mirror I have.
The fix that came out of it was not a new indicator. It was not trading on Friday evenings. That is the kind of conclusion only a record can hand you.
The eight columns that do the work
Anything more than this and you will stop filling it in by the second week. Anything less and it cannot answer questions.
| Column | What goes in it | Why it earns its place |
|---|---|---|
| Date and time | When you entered | Reveals the day and hour patterns you cannot feel |
| Instrument | What you traded | Shows where your edge actually is |
| Why I entered | One sentence, written before you click | A vague sentence is the tell. It means there was no setup |
| Planned exit | Target and the level that would prove you wrong | Turns a hope into a testable statement |
| Actual exit | Where you really got out | The gap between this and the row above is your discipline |
| Risk | Percentage of the account at stake | Catches size creeping up after a loss |
| Followed the plan? | Just Y or N | The single most useful column on the page |
| Mood | Two or three words | Bored, rushed, certain, annoyed. Patterns appear fast |
Note what is not on that list. There is no column for profit, because the profit is not the thing you are trying to learn from, and because a column for profit quietly turns the journal into a scoreboard you will start avoiding on bad weeks.
What a filled row actually looks like
Descriptions of journals are easy to agree with and hard to copy. Here are two real shapes of row, side by side. Same trader, same week.
| Column | A row worth having | A row that teaches you nothing |
|---|---|---|
| Why I entered | “Pullback to the 20 EMA after the level held twice, entering on the reclaim” | “Looked good” |
| Planned exit | “Target the prior high. Wrong below the level at 1.0820” | “See how it goes” |
| Actual exit | “Target hit” | “Closed it, was getting nervous” |
| Risk | 1% | “normal size” |
| Followed the plan? | Y | N |
| Mood | calm, a bit bored | certain, in a hurry |
The right hand column is not a joke, it is what most journals look like in week one. Every entry in it is unfalsifiable. You cannot test “looked good” a month later, you cannot count “normal size”, and a month of rows like that gives you nothing to sort.
The test for any cell is whether someone else could read it back and say you were wrong. “Pullback to the 20 EMA after the level held twice” can be checked. “Looked good” cannot.
Two or three minutes a trade. That is the whole cost, and the entry column gets faster once you notice that the trades which are hard to write down are usually the ones not worth taking.
Take the template
Here is the same eight columns as a spreadsheet you can open and start using. It is free and it does not ask for anything.
Free trading journal template
A spreadsheet file with the eight columns below and nothing else. No email, no signup, no account. It opens in Excel, Numbers, Google Sheets or LibreOffice.
The file is built in your browser. Nothing is sent anywhere and nothing is recorded.
If you would rather use paper, use paper. The medium has never been the problem.
The column everybody leaves out
Of those eight, the one that changes the most is the plainest: did you follow your own plan, yes or no.
It splits two completely different problems that otherwise look identical from the inside.
- You followed the plan and lost. Then the strategy is the thing to examine. Your execution was fine.
- You did not follow the plan and lost. Then the strategy was never tested, and changing it would tell you nothing at all.
- You did not follow the plan and won. This is the dangerous row. It teaches the wrong lesson louder than any loss, and without the column you will never notice it happened.
Most traders who believe their strategy is broken have never actually run it. The Y and N column is how you find that out in an afternoon rather than a year.
How to review it
Writing the journal is half the job. The half that people skip is reading it back, and it takes less time than they expect.
| When | How long | What you are looking for |
|---|---|---|
| After the last trade of the day | Five minutes | Fill in the gaps while you still remember the mood |
| Once a week | Twenty minutes | Count the N rows. Look at where the size moved |
| Once a month | An hour | Sort by day, by hour, by instrument, by setup. Count, do not read |
The monthly one is where findings like mine come from, and it only works once you have enough rows to sort. That is usually somewhere between thirty and fifty trades, which is a few weeks for some people and a few months for others.
What twenty rows will tell you
You do not need a year of data. Twenty honest rows is enough to see most of it.
| What you notice | What it usually means |
|---|---|
| The risk column moves around | Size is being chosen by feeling, not by rule |
| Risk jumps right after a losing row | Revenge trading, whatever you called it at the time |
| “Why I entered” is vague on several rows | Those were not setups. They were boredom or need |
| Actual exit keeps missing planned exit | The plan is being abandoned mid trade |
| Losses cluster on one day or one hour | Tiredness, or a session that does not suit your strategy |
| More rows than you expected | Overtrading. Nearly everyone undercounts by half |
Two or more of these showing up in twenty trades is a pattern, not a bad week. There is more on the first two in how to stop revenge trading and managing risk in trading.
Do you actually need software?
Every article ranking for this question is published by a company that sells a journaling app, so you will not find many straight answers. Here is one.
A spreadsheet is enough if you take fewer than about ten trades a day, if you are willing to type eight fields, and if what you want is to understand your own behaviour. That covers most people reading this, and it is where everyone should start.
Software starts to earn its price when the typing itself becomes the reason you stop. If you scalp, or take thirty trades a session, manual entry will not survive contact with reality, and an app that imports from your broker automatically is worth paying for. The same applies if you want charts attached to every row without saving screenshots by hand.
What software will not do is make you honest. The Y and N column is still filled in by you, and it is still the column that matters.
Common questions
How do I create a trading journal?
Open a spreadsheet, make the eight columns above, and fill in the first one before you place your next trade. That is the entire setup. The template above is the same thing if you would rather not type the headers.
Should I screenshot every trade?
Not at the start. Screenshots are the most common reason a journal dies in week two, because they turn a thirty second task into a five minute one. Once the habit is solid, add a screenshot only for trades you marked N, since those are the ones worth looking at again.
Excel, an app, or a notebook?
Whichever one you will still be using in a month. Paper wins on habit and loses on sorting, which matters only once you have enough rows to sort. Starting on paper and moving to a spreadsheet after thirty trades is a perfectly good path.
How long before it helps?
The discipline effect is immediate, because writing “why I entered” before clicking stops a certain number of trades from happening at all. The pattern finding takes thirty to fifty rows. Mine took a couple of months to produce anything I could act on, and then it produced something that changed my week.
The short version
Eight columns. Write the reason before you click, not after. Mark Y or N honestly. Read it back once a week and count once a month.
The journal is not admin. It is the only place your trading is described by something other than your own memory, and your memory is on your side in a way that is not helping you.