A strategy is a written set of rules: when you enter, where you exit and how much you trade. Analysis is how you decide whether the market in front of you fits those rules today. Neither predicts the future. Their job is to give you a repeatable decision instead of a new guess every time.
This path is two lessons. Read them in order: first how to read the context the market is in, then one complete setup explained on real trades.
Read in this order
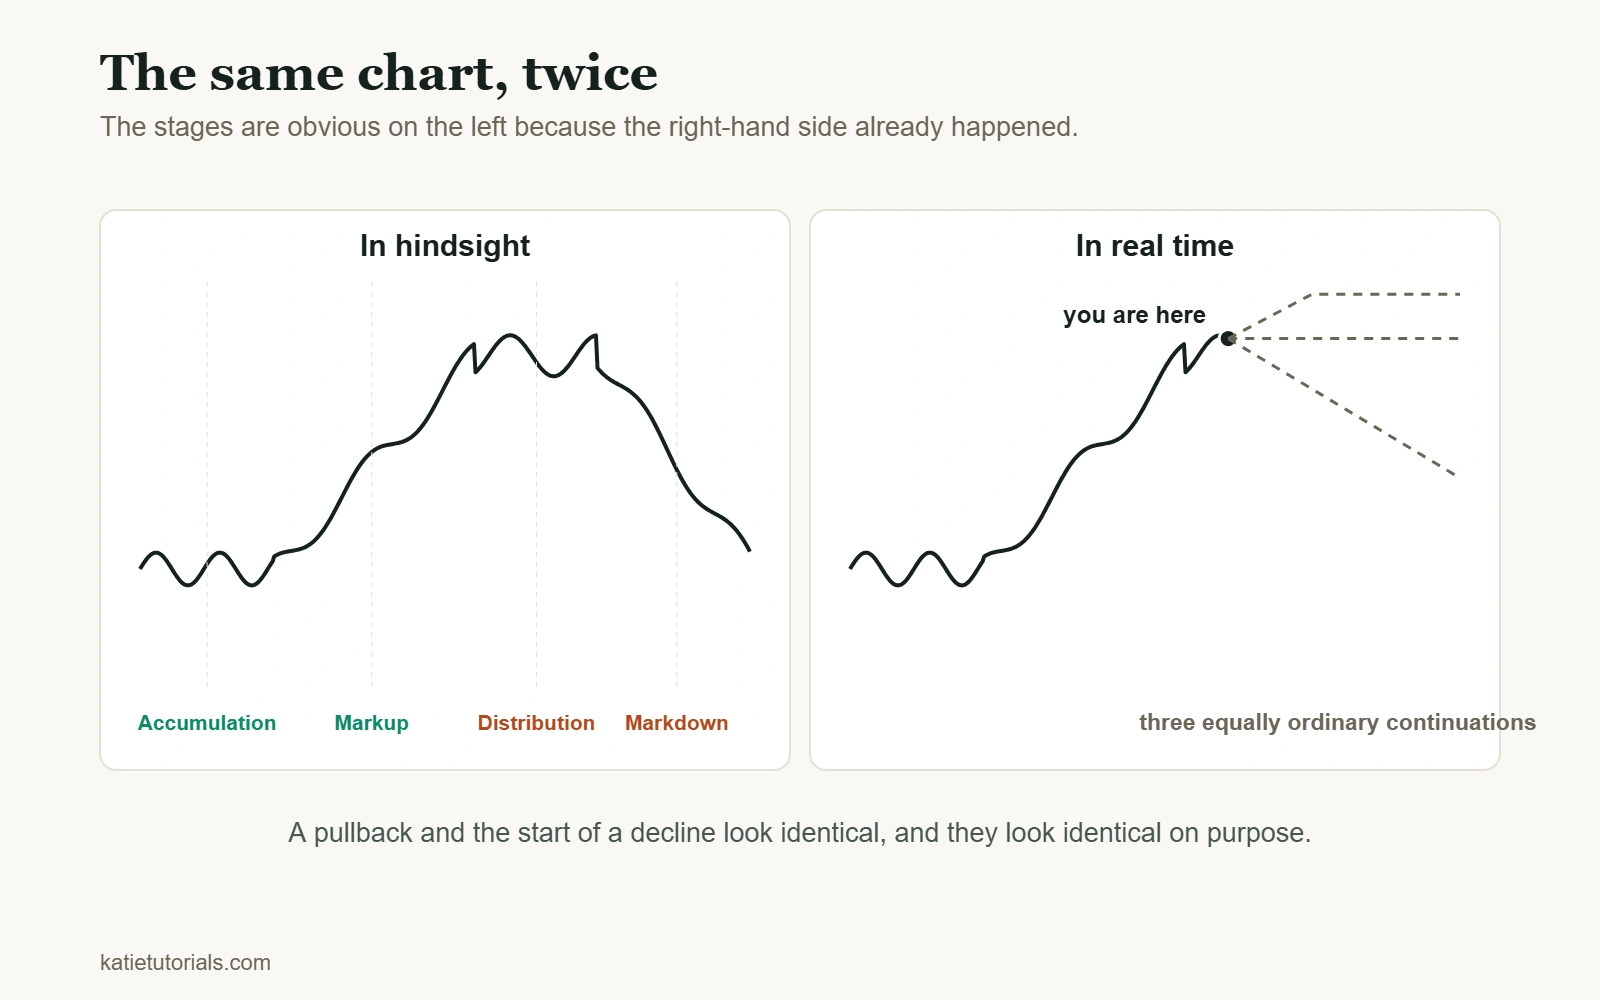
- 1How to Trade Market Cycles (and Why the Diagram Lies)Start here. The four stages describe the past better than they forecast the future. What you can actually see in real time.
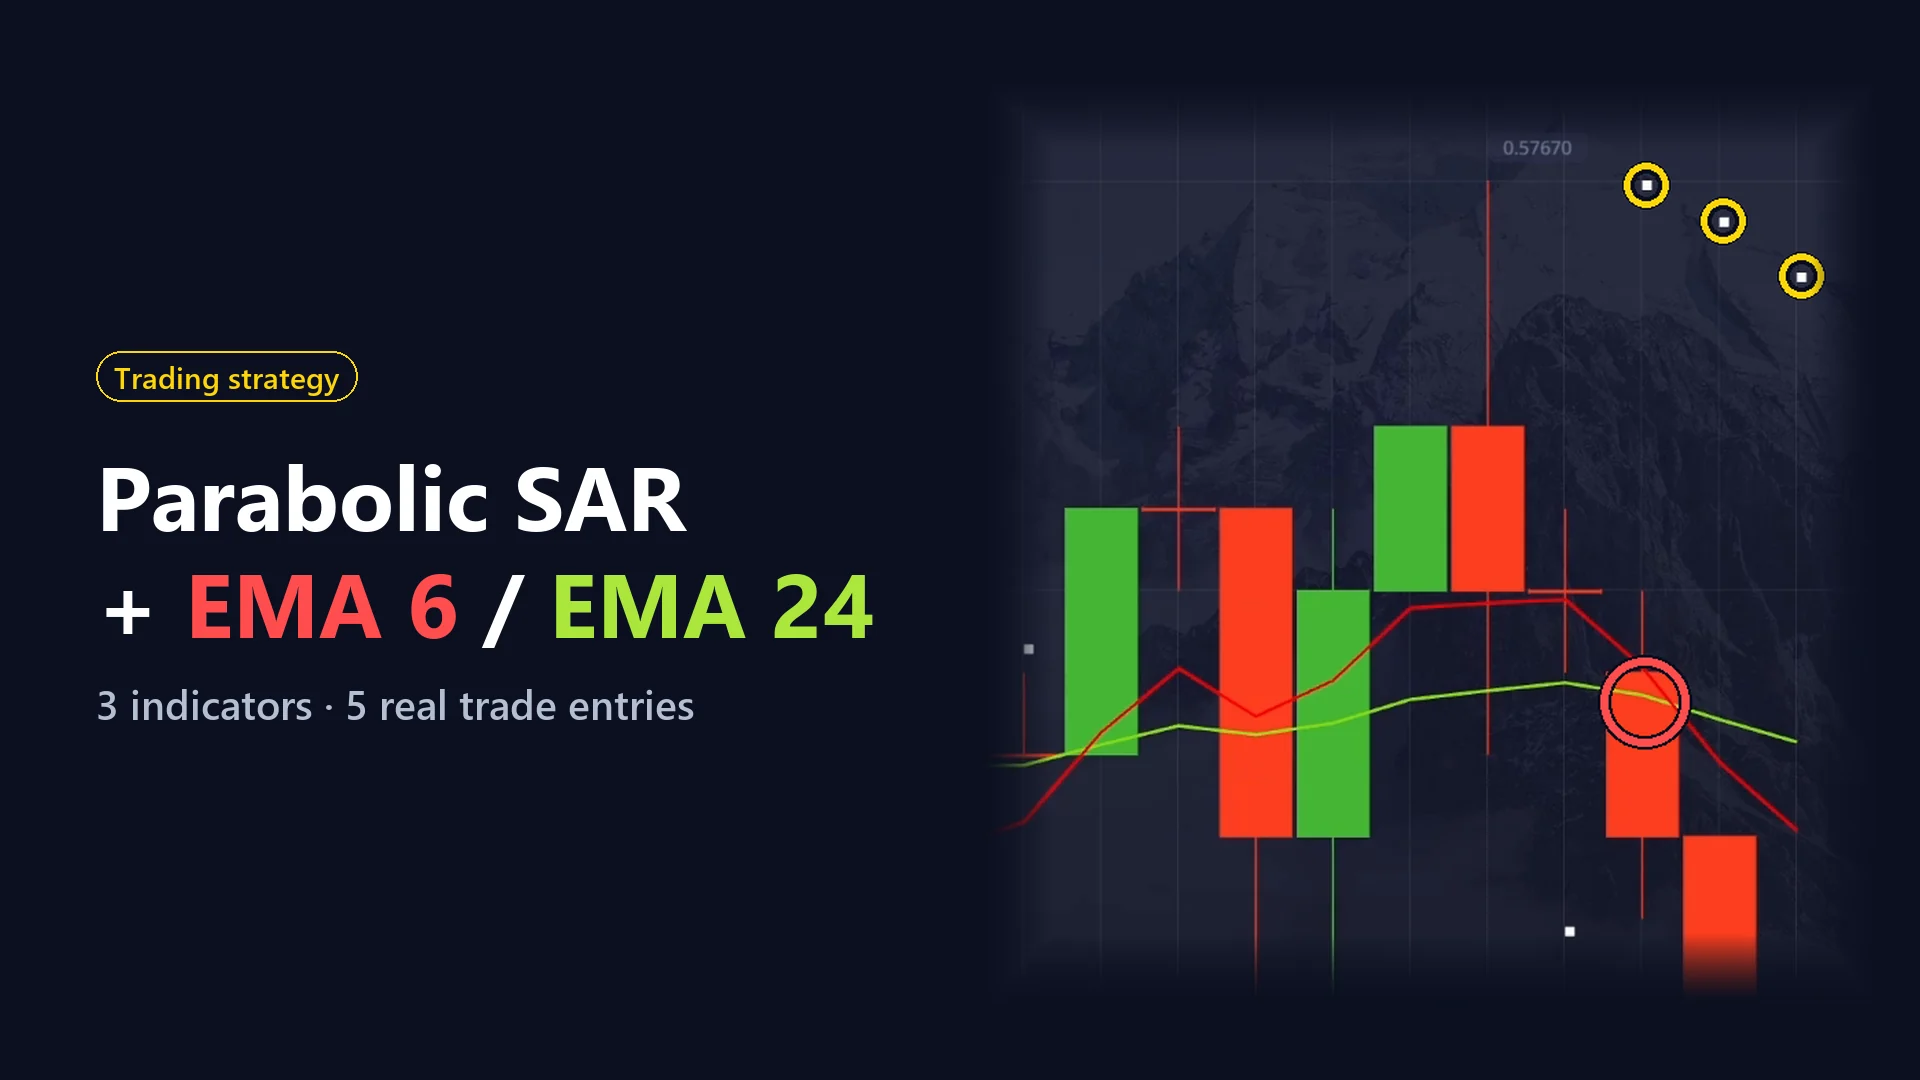
- 2Parabolic SAR and EMA Crossover Strategy: 5 Real 1-Minute Trades ExplainedThen a full setup: the settings, the 3 to 7 dot rule, and five real 1-minute trades on annotated screenshots.
What analysis can and cannot do
Analysis can tell you what kind of market you are in: trending, ranging, quiet or nervous. It cannot tell you what the next candle will do. Beginners lose money looking for the indicator that predicts. Professionals use analysis to decide which of their rules apply today, and whether to trade at all.
What every strategy needs
- Context. The market conditions it is built for. A trend strategy in a range loses by design.
- Entry. A condition you can check without interpretation, so two people would take the same trade.
- Exit. Where you are wrong and where you take profit, both decided before you enter.
- Size. From the risk management path: a fixed share of the account, not a feeling.
What separates professionals from beginners
Rarely the indicator. Professionals trade fewer setups, the same way every time, and record every one. Beginners change the method after three losses and never collect enough trades to know whether it worked. A plain strategy followed for a hundred trades teaches more than ten clever ones tried for a week each.
Pick a strategy that fits your day
Choose a timeframe you can actually watch. If you work during the day, a strategy that needs you at the screen during the busiest hours will not survive contact with your job. A slower chart with fewer, cleaner decisions is often the better strategy for you, even if it looks less exciting.
The setup in this path is shown on 1-minute charts. Fast charts give many signals, and every signal costs a spread. Before you trade any short-term setup with real money, check the costs against your risk per trade, and test it on a demo account long enough to live through a losing streak.
How to know a strategy works
A few good trades prove nothing, and neither do a few bad ones. You need enough trades for the numbers to settle: win rate, average win, average loss and the expectancy that comes out of them. How to Know If Your Trading Strategy Actually Works in the risk management path shows how to calculate it from your own journal.
All lessons in this path, newest first
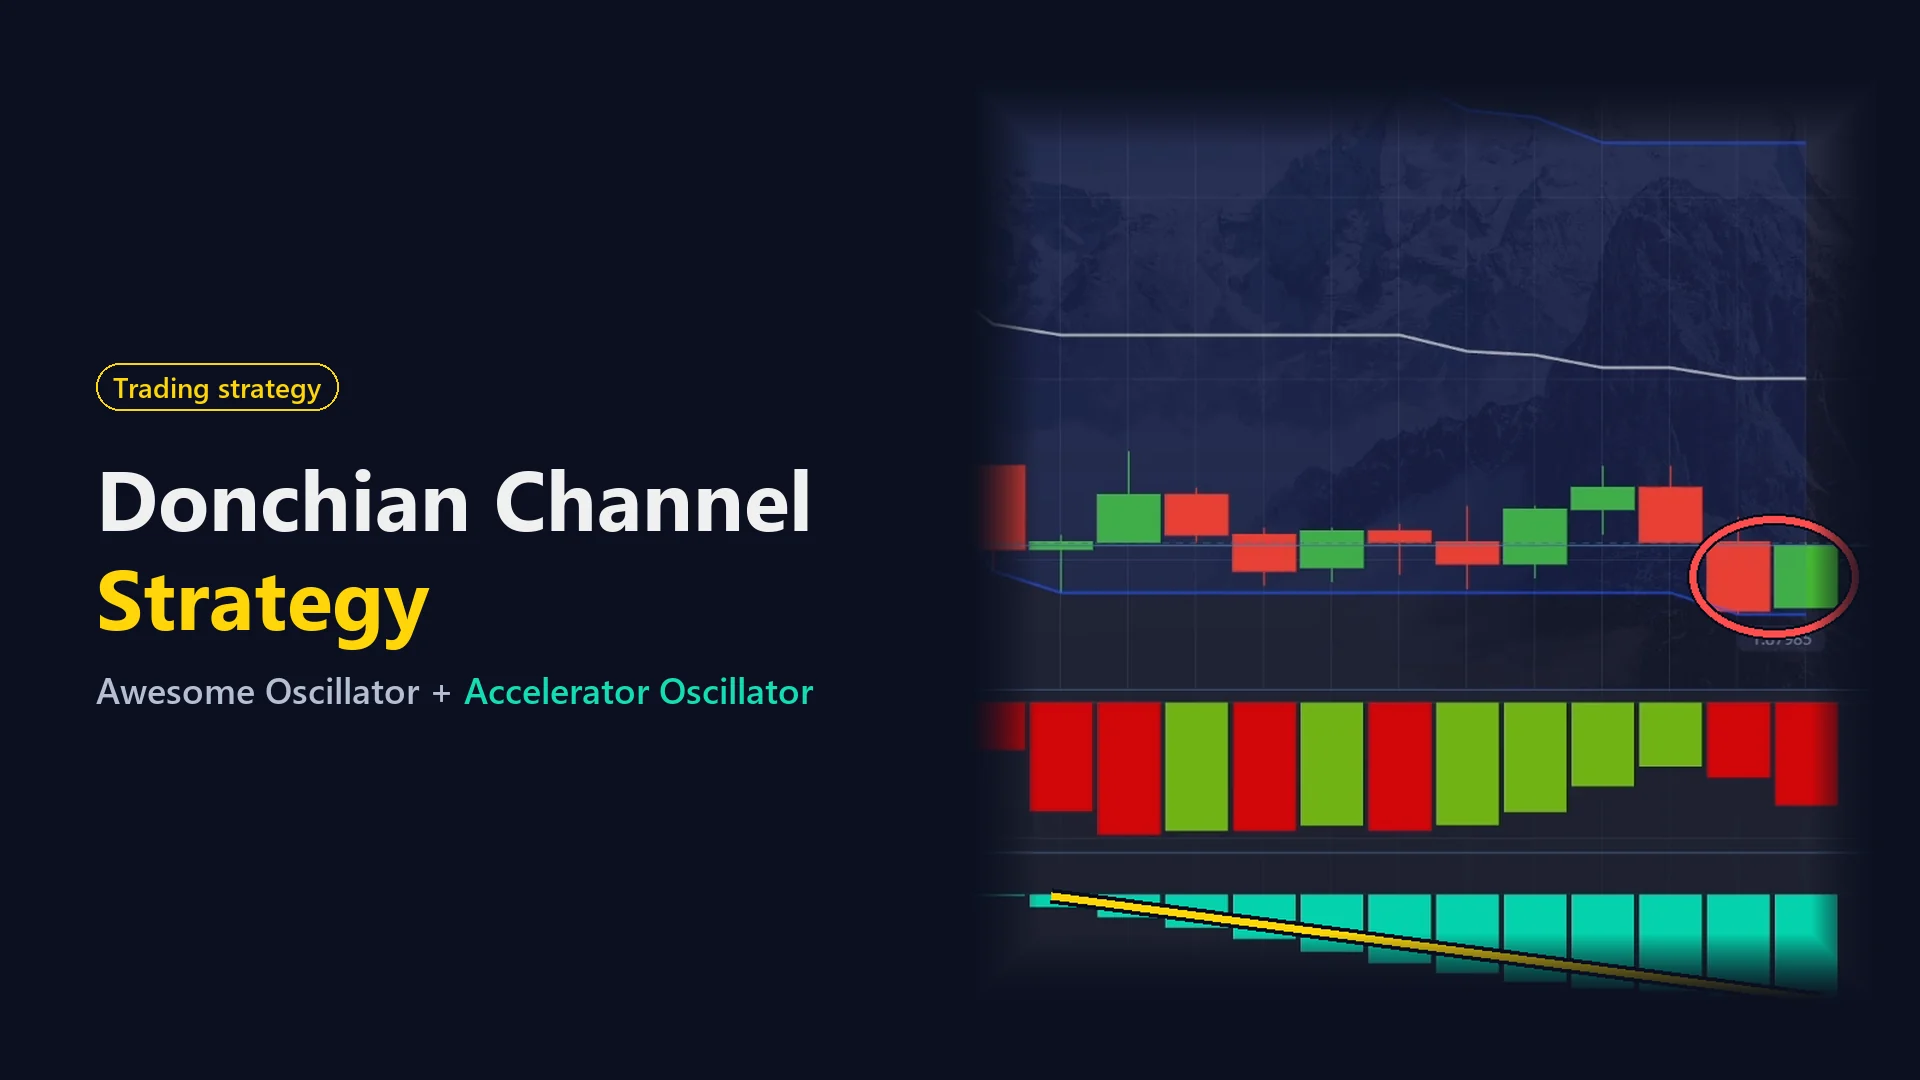
A Donchian Channel strategy with the Awesome Oscillator and the Accelerator Oscillator, explained step by step on 4 real 1-minute trades with screenshots.
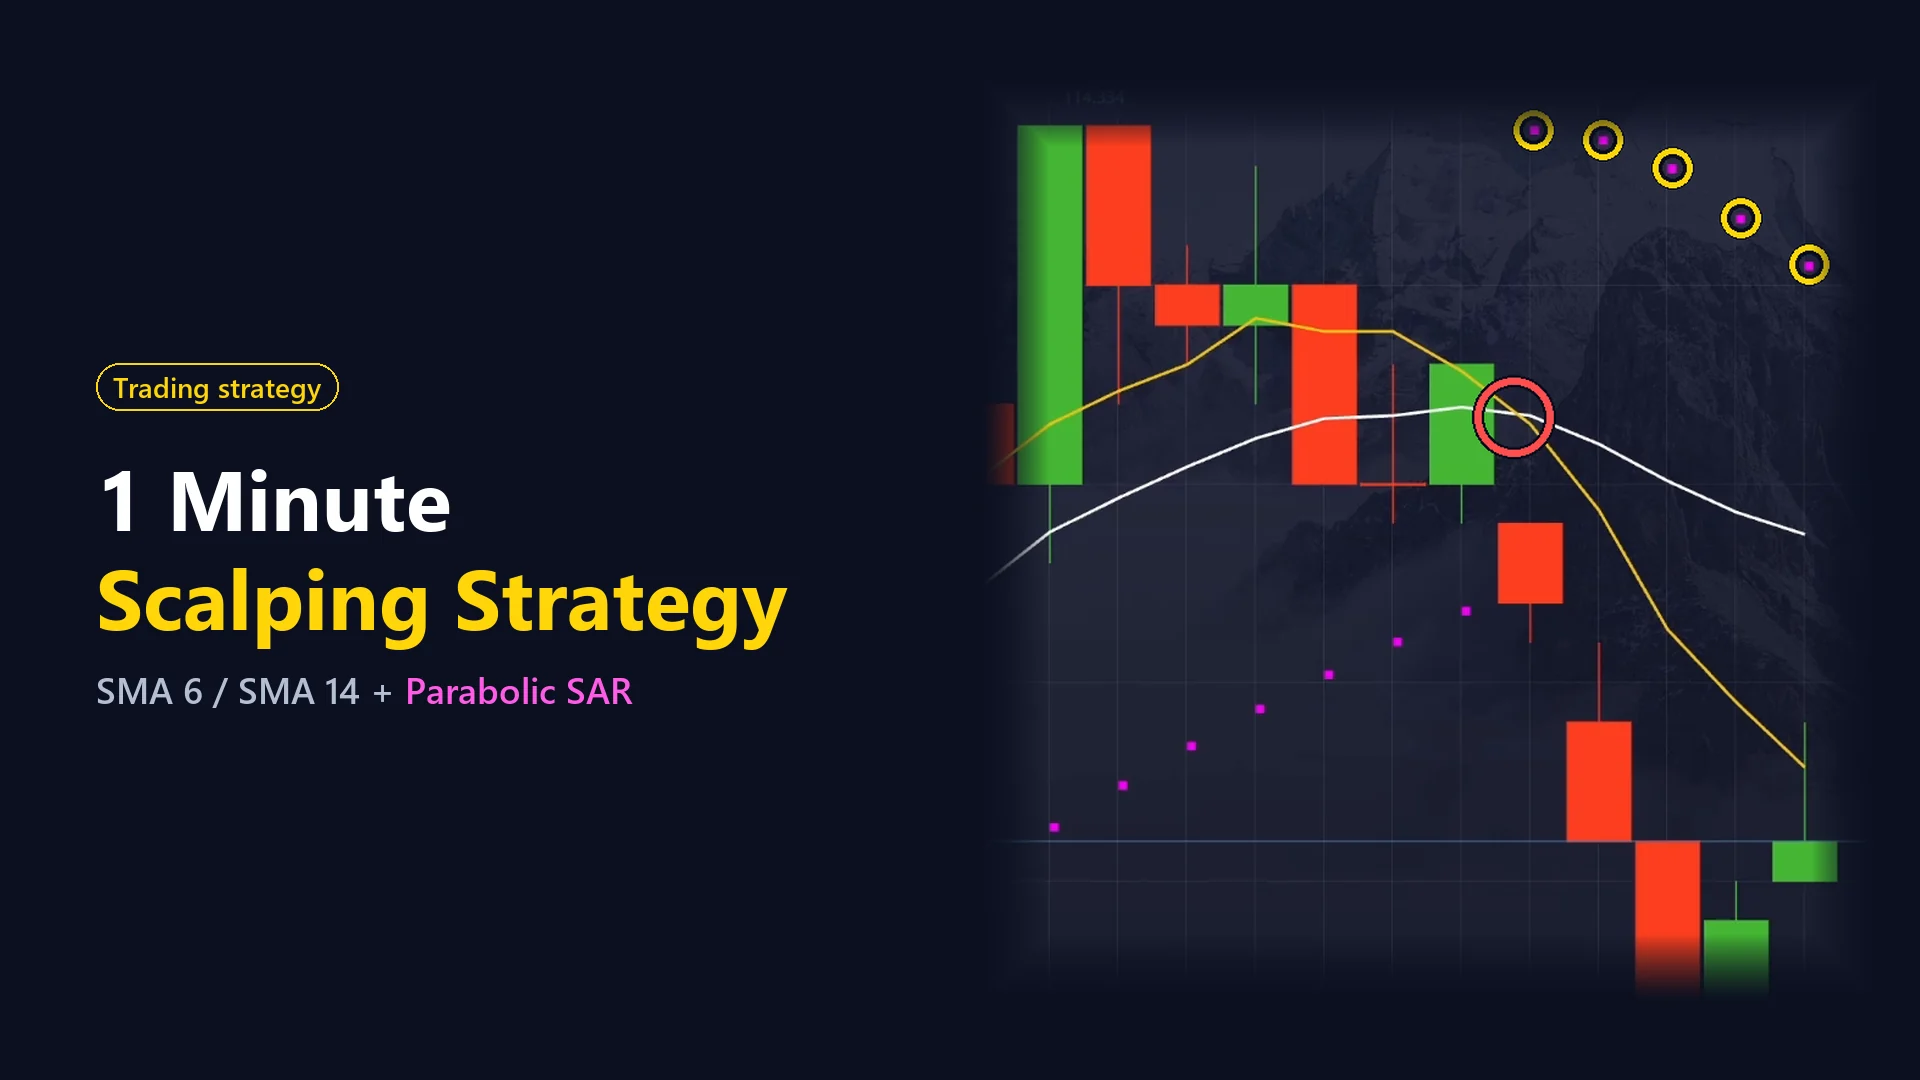
A simple 1 minute scalping strategy with a moving average crossover and the Parabolic SAR, explained step by step on 4 real trades with screenshots.
A Parabolic SAR and EMA crossover strategy: the settings, the 3 to 7 dot rule, and five real 1-minute trades explained on annotated screenshots.
The four stages are a good description of the past and a poor forecast of the future. What you can observe in real time, and how to pick a strategy that suits it.