
Contents (11)
- What is the Donchian Channel?
- The Awesome Oscillator and the Accelerator Oscillator in simple words
- Setting up the indicators
- The main rule: candles must follow the edge of the channel
- 4 real trades, step by step
- Watch the full video
- When I don’t trade with this strategy
- Is this strategy 100% accurate?
- Common mistakes
- Frequently asked questions
- The short version
Today I want to show you a strategy with a different approach. It uses three indicators that many traders don’t know very well: the Donchian Channel, the Awesome Oscillator and the Accelerator Oscillator. I also changed their periods, because the default settings gave me too many weak signals on a 1-minute chart.
This Donchian Channel strategy needs more attention than my simpler methods, but when you learn to read it, the chart becomes much clearer. Below I explain the idea, the settings and the main rule, and then I go through four real trades from one session, screenshot by screenshot. All four closed in profit, but that is one good session, not a promise.
What is the Donchian Channel?
The Donchian Channel is made of three lines drawn around the price:
- Upper line: the highest price of the last N candles.
- Lower line: the lowest price of the last N candles.
- Middle line: exactly halfway between the two.
Because the lines only move when a new high or a new low appears, they look like steps. When the price keeps making new lows, the candles “walk” along the lower line. When it keeps making new highs, they walk along the upper line. That is exactly what this strategy looks for.
The default period is 20. I use 50. With a longer period the channel is calmer, and the candles reach the edge only when the move is really strong.
The Awesome Oscillator and the Accelerator Oscillator in simple words
Both indicators were created by Bill Williams, and they work together nicely.
- The Awesome Oscillator compares a fast and a slow average of the price. It shows the direction and the strength of the move. In my colors, blue bars mean the Awesome Oscillator is falling and yellow bars mean it is rising.
- The Accelerator Oscillator goes one step further. It shows whether that move is speeding up or slowing down. Red bars mean the momentum is pointing down, green bars mean it is pointing up.
Put simply: the Donchian Channel shows where the candles are, the Awesome Oscillator shows how strong the trend is, and the Accelerator Oscillator shows whether it is getting stronger right now.
Setting up the indicators
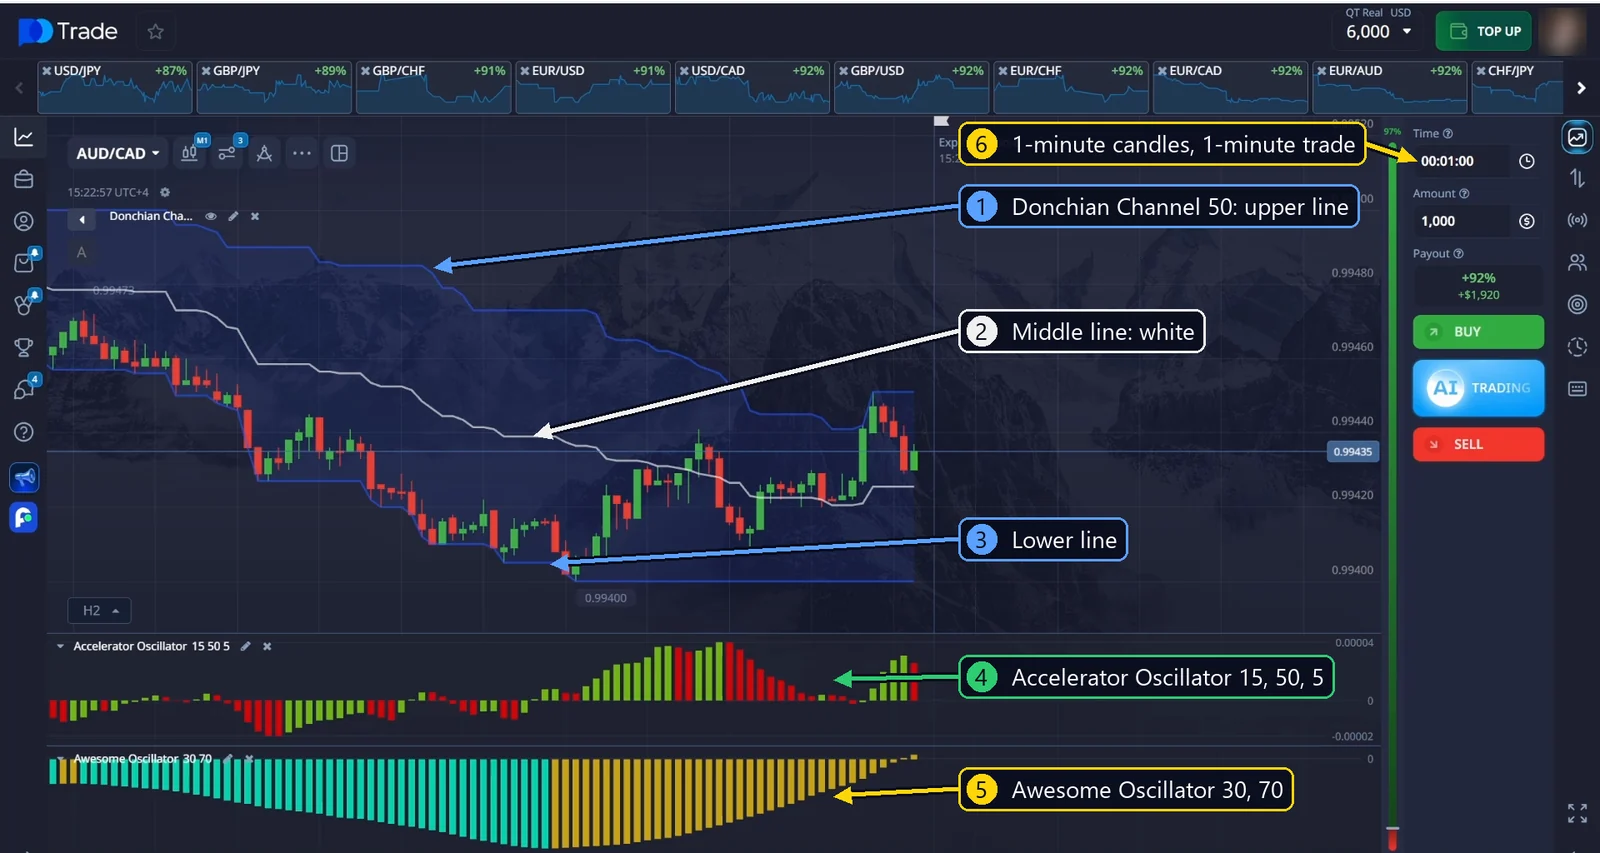
First I add the Accelerator Oscillator. It plays a particularly important role in this strategy. I set its periods to 15, 50 and 5.
The second indicator is the Awesome Oscillator. I increase its periods to 30 and 70 and change the colors to yellow and blue.
The third is the Donchian Channel with a period of 50. I only change the color of the middle line to white, so it is easy to see.
Then I set the chart to regular 1-minute candles and the trade duration to 1 minute as well, and pick the currency pair.
| Indicator / setting | Value | Color |
|---|---|---|
| Accelerator Oscillator | 15, 50, 5 | Green / red (default) |
| Awesome Oscillator | 30, 70 | Yellow (rising), blue (falling) |
| Donchian Channel | Period 50 | Middle line white |
| Candles | 1 minute | |
| Trade duration | 1 minute |
The main rule: candles must follow the edge of the channel
In most cases I open a trade when the candles are very close to one of the blue lines, or touching it. And it is not only about the last candle. The previous candles should also be touching that line or staying close to it. In general, the candles should be consistently following the line.
- SELL: the red candles keep following the lower blue line.
- BUY: the green candles keep following the upper blue line.
Then I check the oscillators. For a SELL, I want the Awesome Oscillator bars to be blue and the Accelerator Oscillator bars to be red. For a BUY, the Awesome Oscillator bars should be yellow and the Accelerator Oscillator bars green.
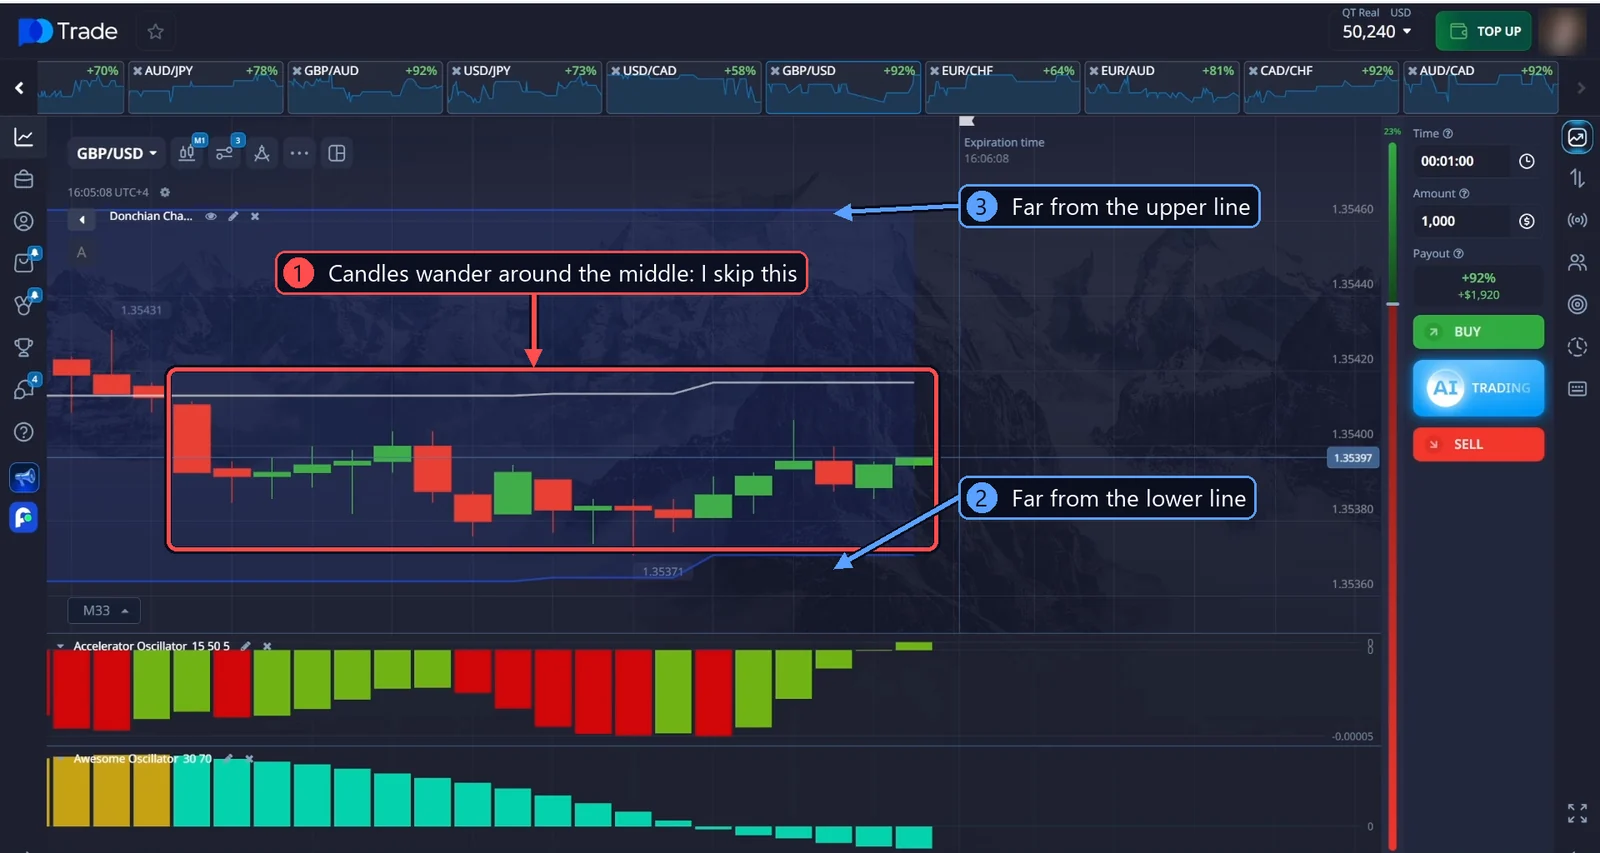
Never trade the middle
This is just as important. When the candles move around the middle white line, far from both blue lines, there is no clear trend. The price can go either way, so I simply don’t open a trade on that pair. I look for another one where the candles are hugging an edge.
Quick checklist
| SELL | BUY | |
|---|---|---|
| Donchian Channel | Candles follow the lower blue line | Candles follow the upper blue line |
| Awesome Oscillator | Blue bars, ideally growing down | Yellow bars, ideally growing up |
| Accelerator Oscillator | Red bars | Green bars |
| Avoid | Candles around the middle line | |
| Duration | 1 minute | 1 minute |
4 real trades, step by step
Each screenshot below was taken at the moment of entry, right before I clicked the button. The numbers on the arrows match the explanation under the picture.
Trade 1: EUR/CAD, SELL
In the video: 1:51 · Payout 92%
Why I entered:
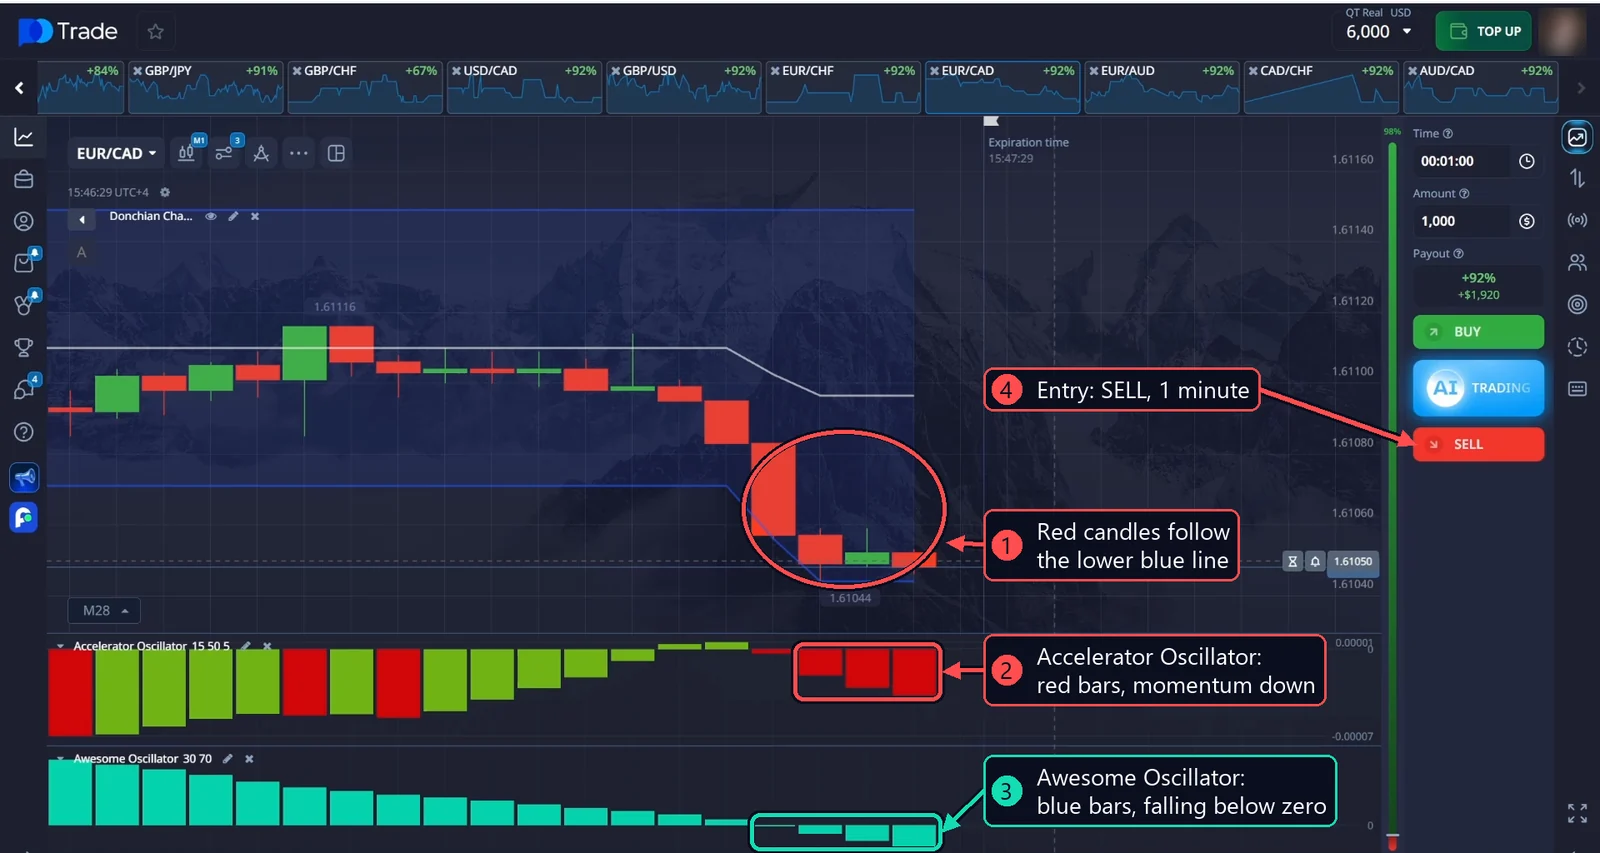
- The price dropped hard, and the red candles are now very close to the lower blue line. Not only the last candle: the ones before it are touching the line too. This is the main signal of the strategy.
- The Accelerator Oscillator has turned red, so the momentum is pointing down.
- The Awesome Oscillator bars are blue and falling below zero.
- Everything points down. I open a SELL for 1 minute.
Result: my first winning trade of the session, and a perfect example of the main setup.
Trade 2: GBP/JPY, SELL
In the video: 2:48 · Payout 91%
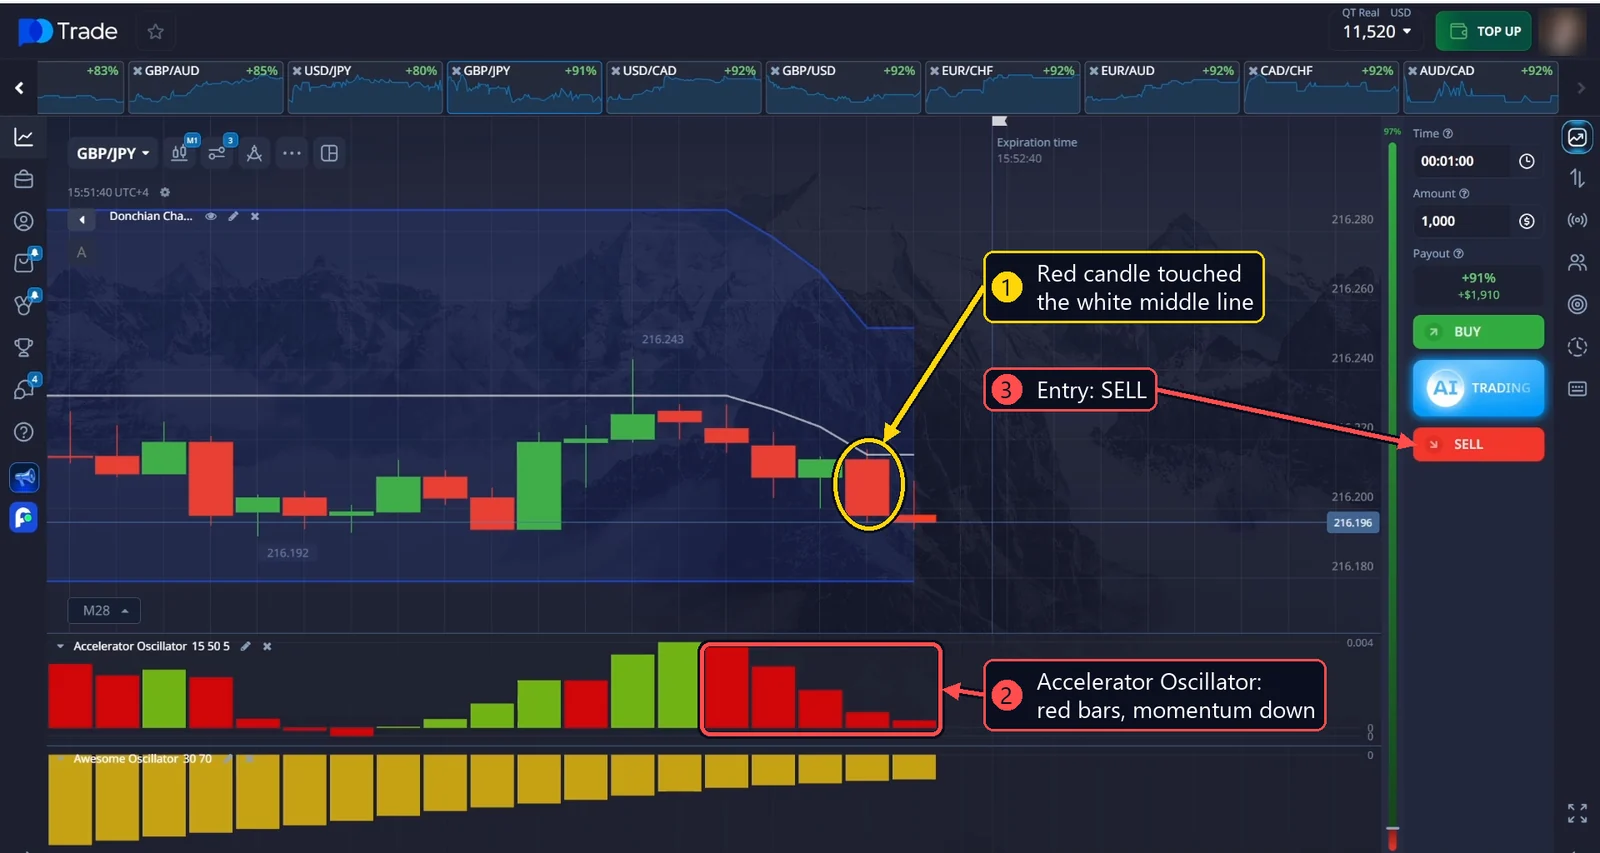
This is the second type of opportunity I look for with this strategy. It needs a lot of experience and attention, so I rarely take trades like this one.
Why I entered:
- There is no clear direction here yet, and normally the strategy needs one. But the red candle touched the white middle line and then kept moving down. The middle line worked like a ceiling.
- The Accelerator Oscillator bars are red, so the momentum is on the side of a SELL.
- It is a harder situation, but the signals agree. I open a SELL.
Result: I won this one too. Still, if you are new to the strategy, skip setups like this and wait for the clear ones.
Trade 3: GBP/CAD, SELL
In the video: 3:45 · Payout 87%
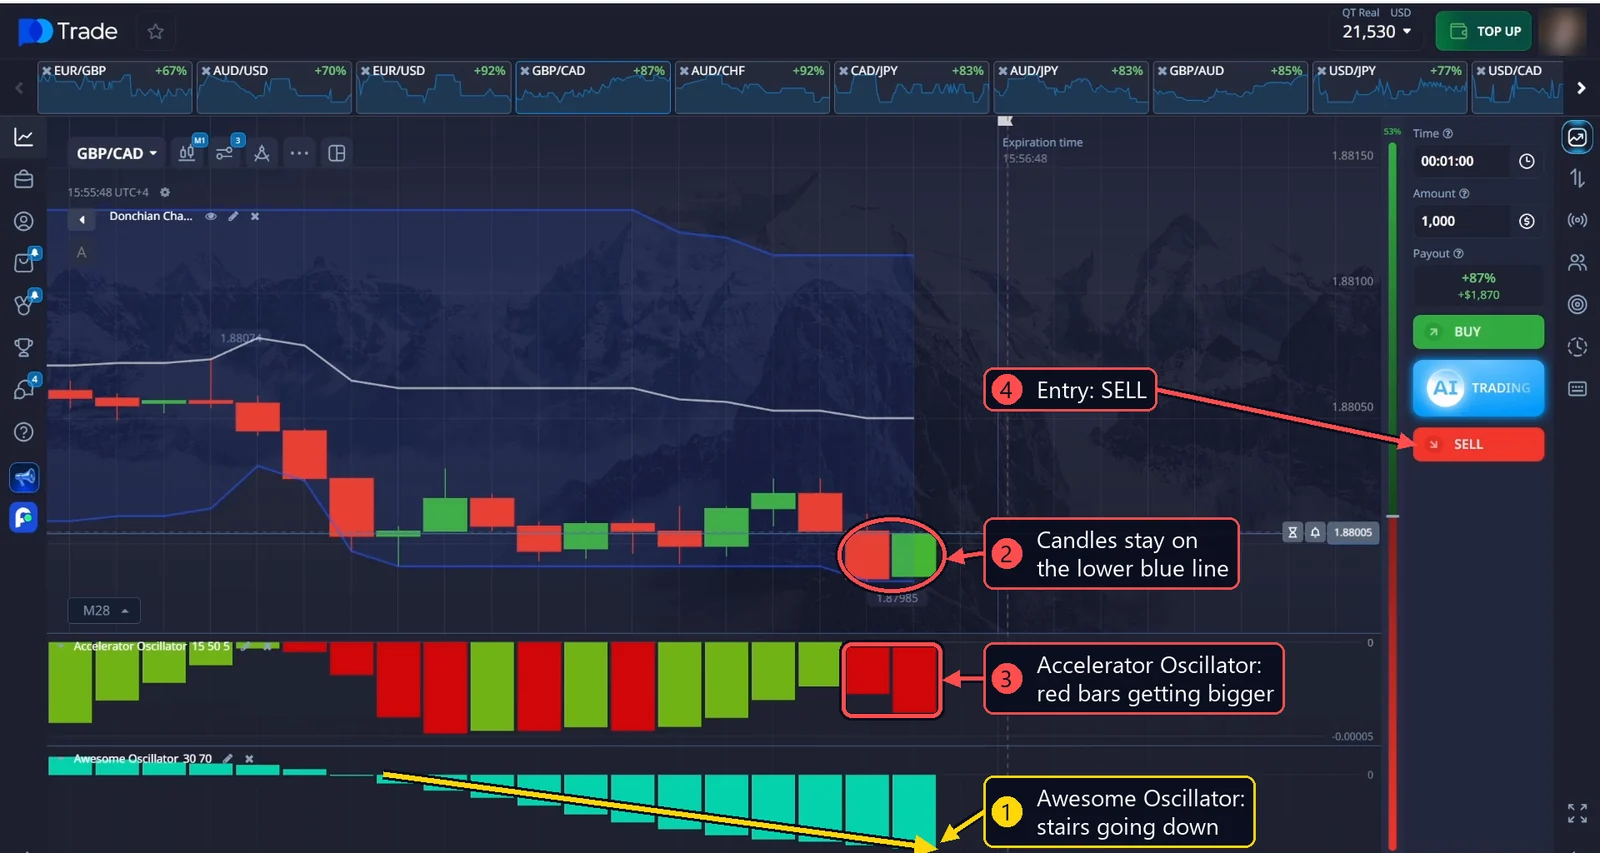
Why I entered:
- Look at the Awesome Oscillator. The blue bars move down like steps on a staircase, and each step gets bigger. This is one of the most reliable signals I look for with this indicator. It shows that the downtrend is strong. Without the Awesome Oscillator, I might not have noticed such a clear trend at all, and that’s why it is one of my favorite indicators.
- The candles stay on the lower blue line of the Donchian Channel.
- The Accelerator Oscillator bars are red and getting bigger, so the downward momentum is growing.
- I open a SELL.
Result: another win.
Trade 4: GBP/CAD, SELL
In the video: 4:46 · Payout 87%
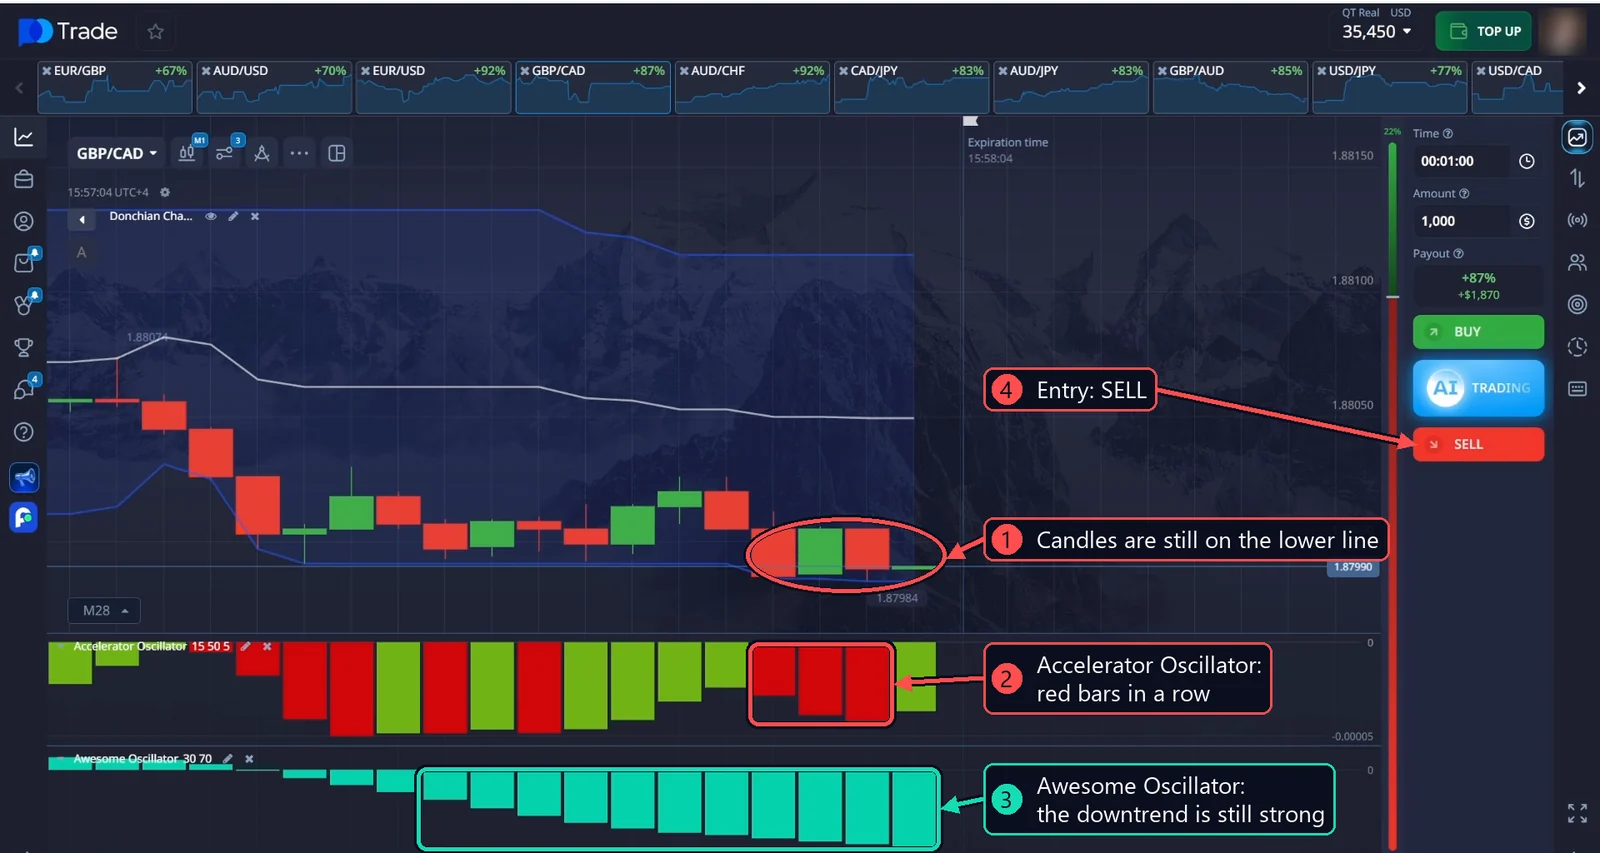
Why I entered:
- After the win I stayed on the same pair, because the downward signal from the candles and the indicators was still there. The candles are still on the lower line.
- The Accelerator Oscillator is easier to read than it looks. Even one red bar already shows a bearish signal. The stronger signal comes when the bars keep going or grow in the same direction as my trade. Here there are several red bars in a row, so the momentum is still pointing down.
- The Awesome Oscillator bars are big and blue. The downtrend is still strong.
- I open another SELL.
Result: a win again. That makes four wins out of four trades in this session.
Watch the full video
When I don’t trade with this strategy
My main rule is very simple: I never open a trade on a currency pair where the candles are not consistently following one of the boundaries of the Donchian Channel.
I also avoid entering when the candles are around the middle line. My goal is a clearly established trend. It can be up or down, that doesn’t matter, as long as the candles keep following the blue line. These are the setups that give me the most reliable results.
Is this strategy 100% accurate?
No, and no strategy ever is. Four out of four is a good session, not a promise. Some days my win rate is higher, some days it is lower. That is simply how short-term trading works.
What helps is having clear rules and sticking to them. Before you trade with real money, test the strategy on a demo account and keep notes. And whatever happens, risk only a small part of your balance on a single trade.
Common mistakes
- Trading in the middle of the channel. If the candles are far from both blue lines, there is no trend to follow.
- Entering on one touch. One candle touching the line is not enough. The candles before it should be following the line too.
- Ignoring the oscillators. If the candles are on the lower line but the Awesome Oscillator is yellow and the Accelerator Oscillator is green, the signals disagree. Wait.
- Taking the hard setups too early. The middle-line trade (Trade 2) needs experience. Start with the clear ones.
Frequently asked questions
What is the best Donchian Channel setting for a 1-minute chart?
The default is 20, but on a 1-minute chart I prefer 50. The channel becomes calmer, and the candles reach its edges only during strong moves. That makes the “candles follow the line” signal more meaningful.
What is the difference between the Donchian Channel and Bollinger Bands?
The Donchian Channel uses the highest high and the lowest low of the last candles, so its lines move in flat steps. Bollinger Bands are built around a moving average and widen or narrow with volatility, so they are smooth curves. For this strategy the Donchian Channel is easier to read, because you can clearly see when the candles keep making new lows or new highs.
What is the difference between the Awesome Oscillator and the Accelerator Oscillator?
The Awesome Oscillator shows the direction and strength of the trend. The Accelerator Oscillator shows whether that trend is speeding up or slowing down. In this strategy the Awesome Oscillator tells me the trend is strong, and the Accelerator Oscillator tells me the momentum is still on my side.
Can I use this strategy for BUY trades?
Yes. All four trades in this session were SELL trades, but the rules work the same way upward: the candles follow the upper blue line, the Awesome Oscillator bars are yellow and the Accelerator Oscillator bars are green.
Is this strategy good for beginners?
The main rule is simple, but reading three indicators at once takes practice, and 1-minute trading is fast. If you are new, practice on a demo account first and start with the clear setups, where the candles follow the edge of the channel.
The short version
Find a pair where the candles keep following one blue line of the Donchian Channel. Check that the Awesome Oscillator and the Accelerator Oscillator point the same way. When everything agrees, open a 1-minute trade in that direction. When the candles are around the middle line, skip the pair and look for another one.
If you prefer simpler setups, try my 1 minute scalping strategy with a moving average crossover. I hope this one helps you read the chart a little more clearly. Good luck, and take care of your balance.
I’m Katie. I’ve been trading for more than seven years, and most of my own trading is short-term options like the trades above. More about me.
Remember: trading involves risk. This article is for educational purposes only and is not a recommendation to copy my actions. You alone are responsible for all of your trading decisions.