
Contents (11)
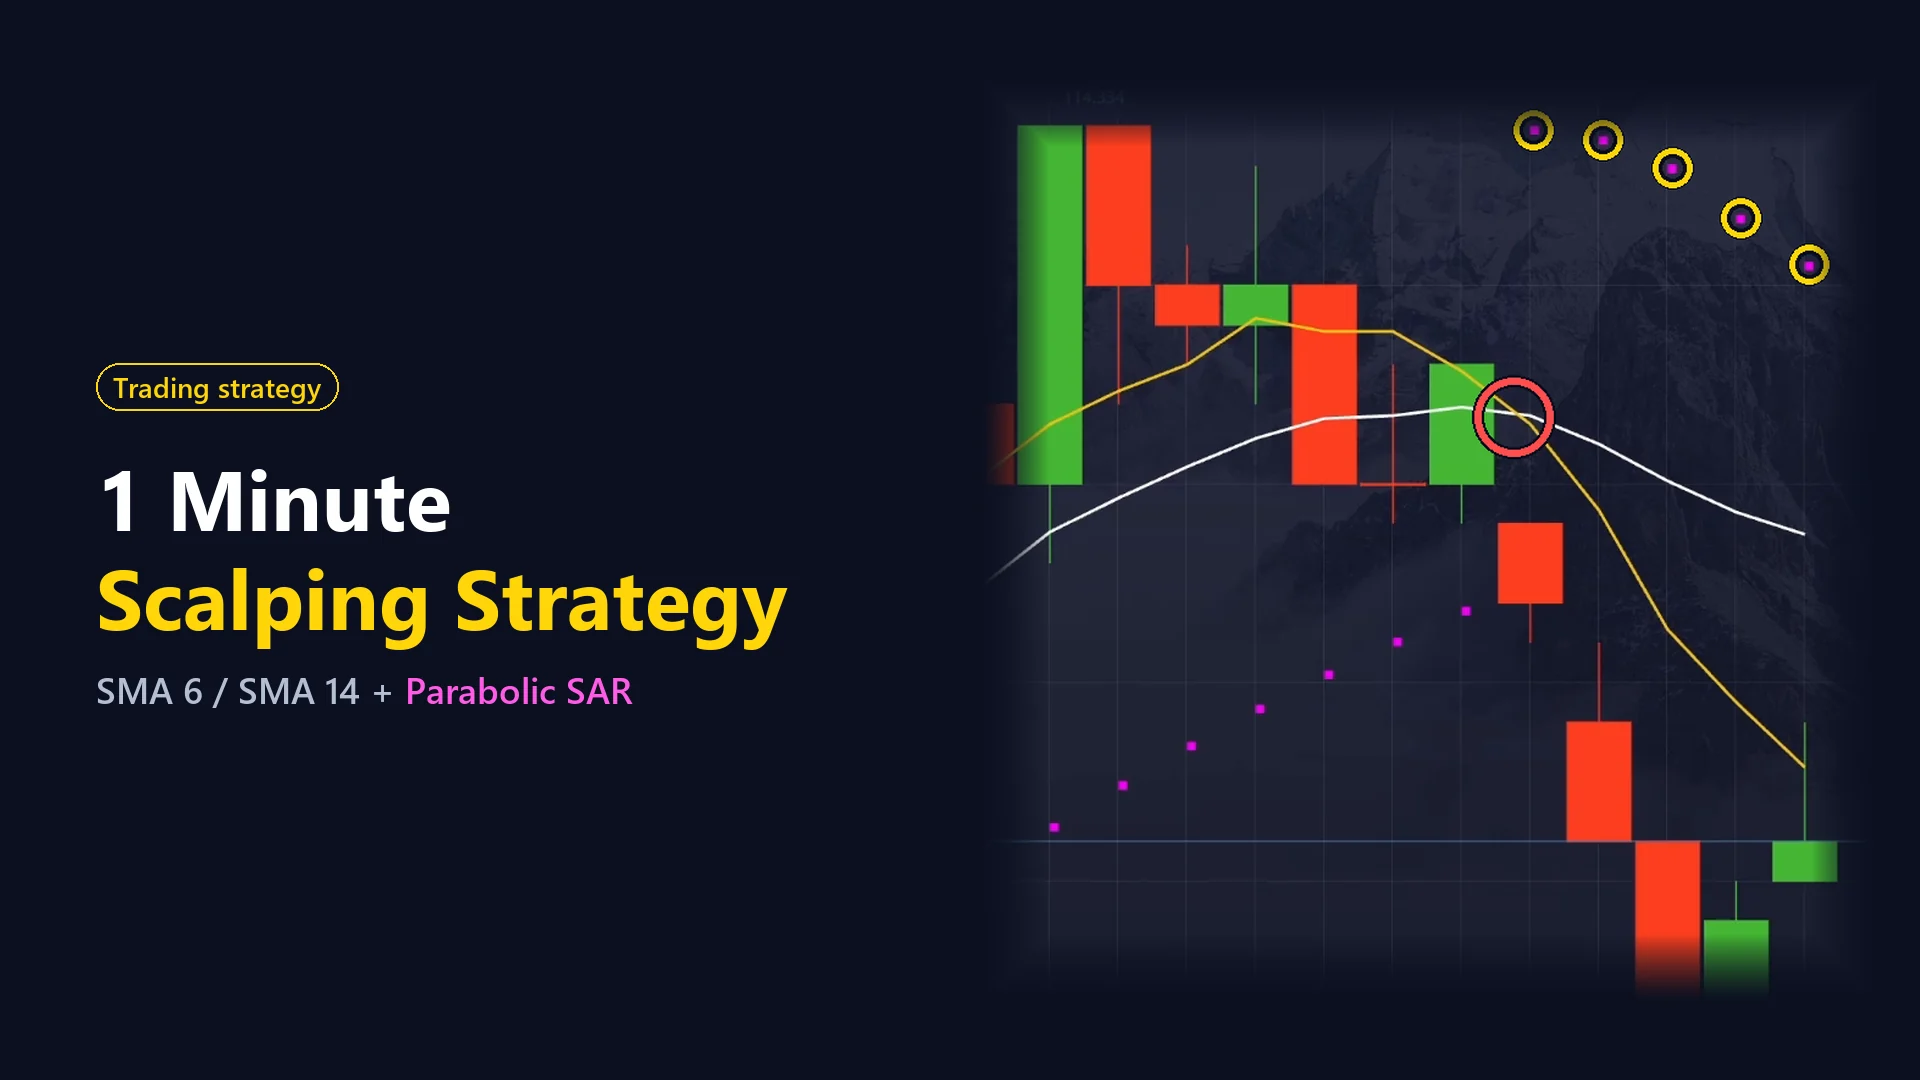
In my previous lesson I showed a Parabolic SAR and EMA crossover strategy on 30-second candles. This one is its faster sister. I changed most of the indicator settings and made the candles shorter, so everything is tuned for 15-second candles and 1-minute trades.
In this session I took four trades with it, and all four closed in profit. That doesn’t mean the strategy always wins. No strategy does. But it is a good example of what happens when every piece lines up, so below I go through each trade on the screenshot and explain exactly why I pressed the button.
What is a 1 minute scalping strategy?
Scalping means taking short trades that try to catch a small piece of a move. Here a trade lasts just one minute. You don’t need to predict where the price will be tomorrow, only where it is likely to go in the next sixty seconds.
That sounds easy, but one minute is short, and the chart is noisy. That’s why this strategy uses three filters: the trend, a moving average crossover and the Parabolic SAR. When all three agree, I trade. When even one is missing, I wait.
Setting up the indicators
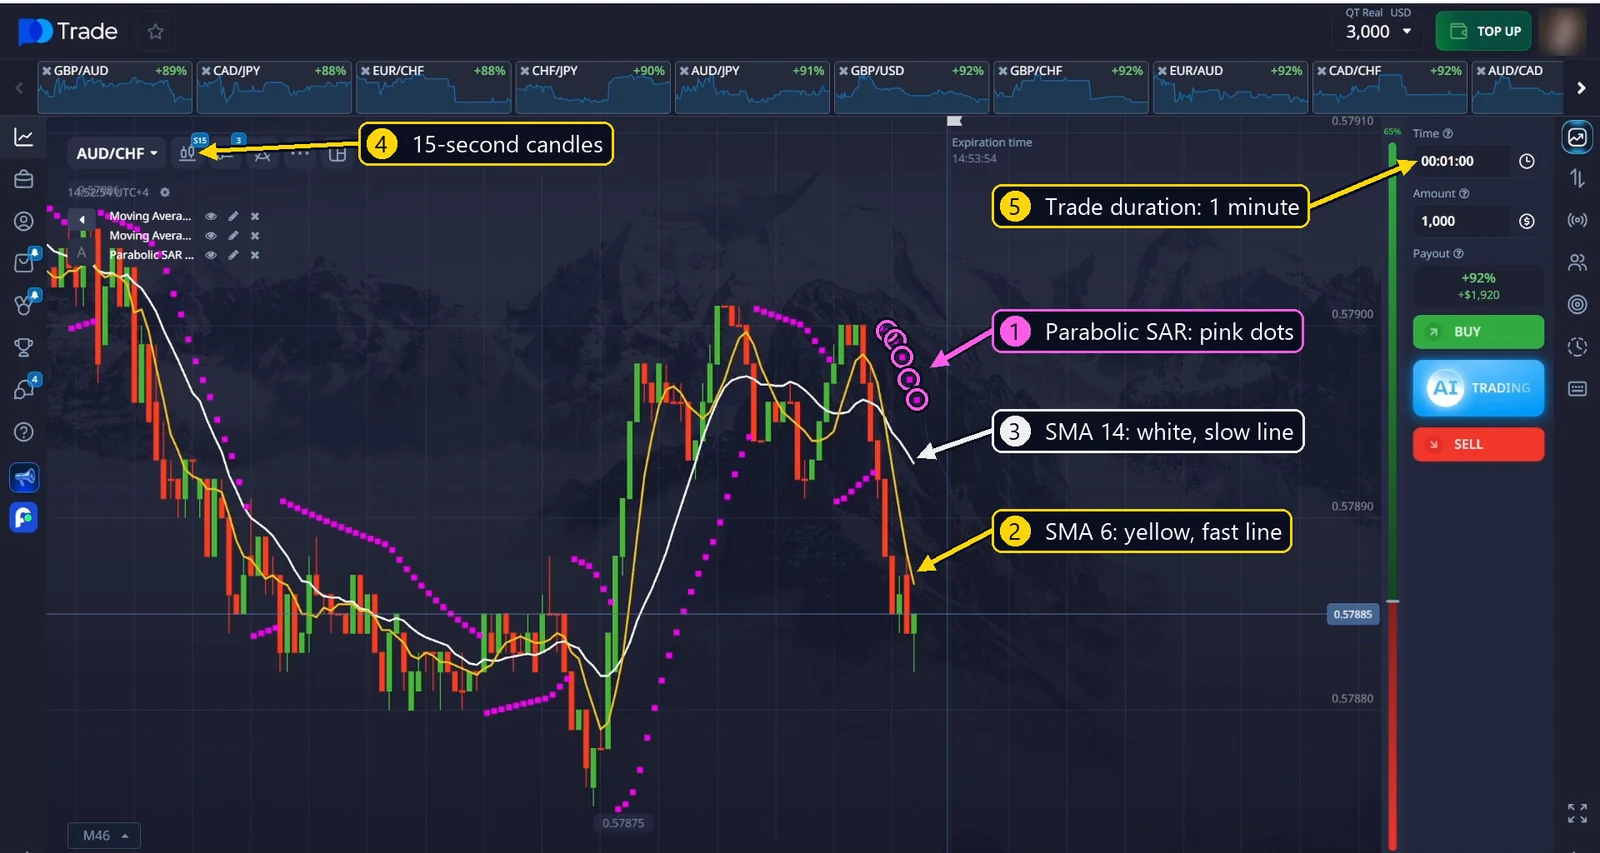
The first indicator is a Moving Average with a period of 14. I leave the type as SMA (simple moving average) and make the line white. This is the slow line.
The second is another Moving Average, this time with a period of 6. The type is SMA again, the color is yellow, and I make the line a bit thicker so it is easy to see. This is the fast line.
The last indicator is the Parabolic SAR. I keep the step at 0.02 and raise the maximum acceleration to 0.3. The color is pink.
Then I switch the chart to regular 15-second candles and set the trade duration to 1 minute. Finally, I pick the currency pair with the highest payout at that moment.
| Indicator / setting | Value | Color |
|---|---|---|
| Moving Average (slow) | Period 14, SMA | White |
| Moving Average (fast) | Period 6, SMA | Yellow, thick |
| Parabolic SAR | Step 0.02, Maximum 0.3 | Pink |
| Candles | 15 seconds | |
| Trade duration | 1 minute |
Why the trend matters most
Besides the indicators, the trend plays one of the biggest roles in this method. I watch how the candles move all the time. For me it is the compass: it tells me which direction is worth looking at before I even check the lines.
Think of it like swimming in a river. You can swim against the current, but it is much easier to go with it. The indicators tell me when to jump in. The trend tells me which way the water is flowing.
The trend doesn’t have to be strong. Even a gentle downtrend works for me, as long as the indicators confirm it. What I avoid is a chart that goes sideways with no clear direction, because there the lines cross back and forth all the time and give false signals.
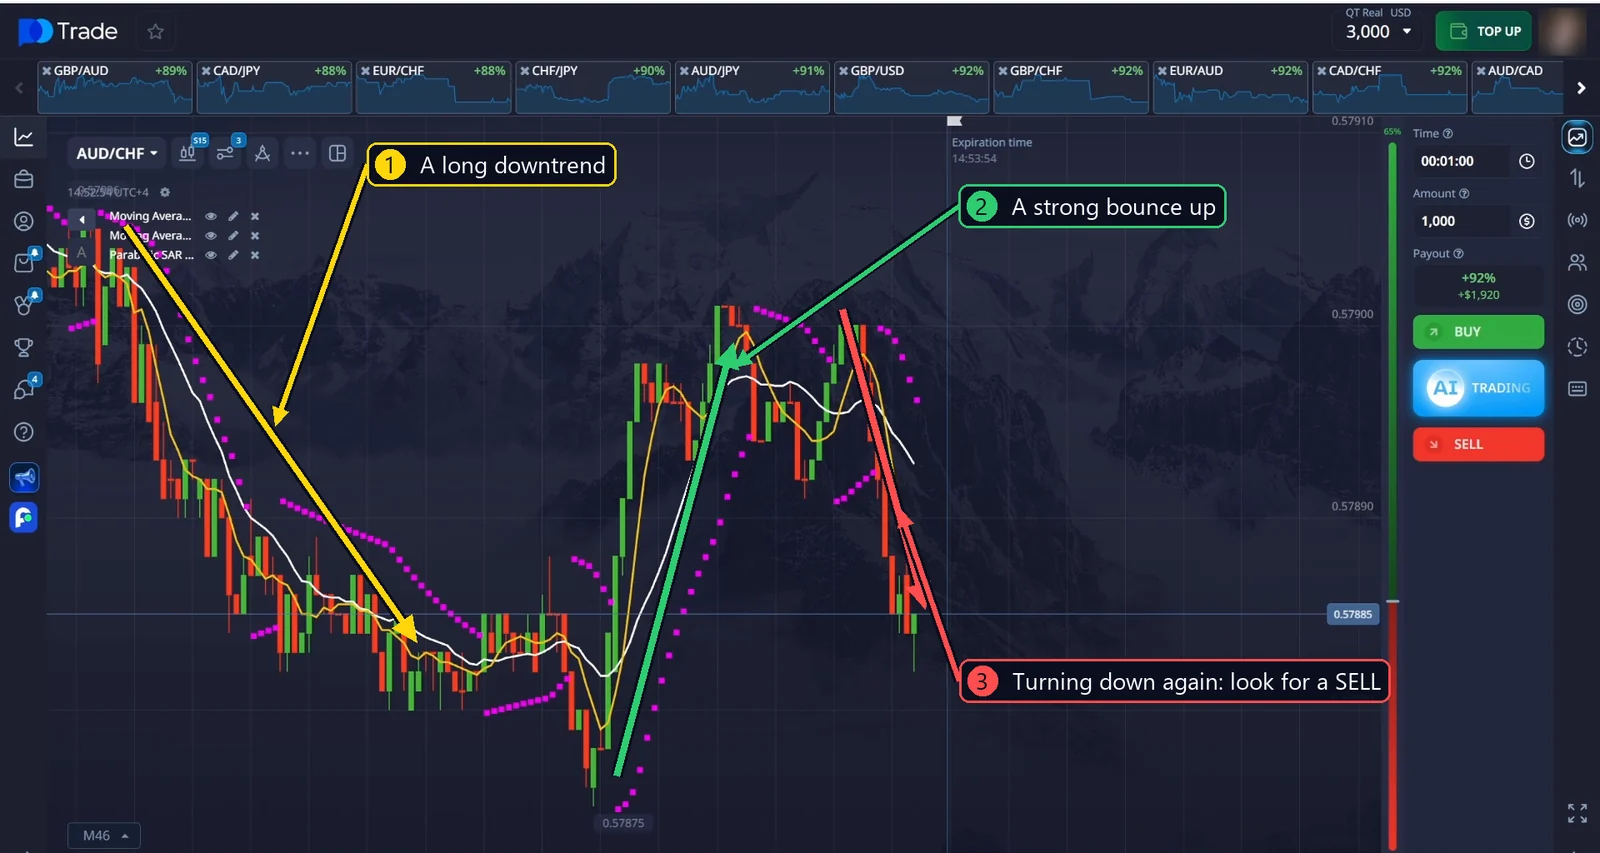
Sometimes I zoom out or add one more indicator just to see the long-term trend faster. It saves time: I know the direction before I start looking for an entry.
The entry rules
The moving averages work a little differently here than in my other methods, so this part is worth reading slowly.
- SELL: the yellow line (SMA 6) crosses the white line (SMA 14) from above to below, and the Parabolic SAR dots sit above the price.
- BUY: the yellow line crosses the white line from below to above, and the Parabolic SAR dots sit below the price.
One more thing: the crossover should be recent. If the lines crossed just now, the signal is much stronger. If they crossed a long time ago, the move may already be over, and you would be entering late.
Quick checklist
| SELL | BUY | |
|---|---|---|
| Trend | Candles moving down | Candles moving up |
| SMA 6 / SMA 14 | Yellow just crossed below white | Yellow just crossed above white |
| Parabolic SAR | Dots above the price | Dots below the price |
| Duration | 1 minute | 1 minute |
When I use this strategy, and when I don’t
I use it when the chart already has a direction. The trend doesn’t have to be strong. Even a gentle one is enough, as long as the trend, the moving averages and the Parabolic SAR all agree.
- I trade when the candles are clearly moving one way, the yellow and white lines have just crossed in the same direction, and the Parabolic SAR dots sit on the right side of the price.
- I wait when the chart moves sideways and the two lines keep crossing back and forth. There is no trend to follow there.
- I wait when the crossover happened many candles ago. The move may already be over.
- I wait when the indicators disagree with each other. One good signal out of three is not enough.
4 real trades, step by step
Each screenshot below was taken at the moment of entry, right before I clicked the button. The numbers on the arrows match the explanation under the picture.
Trade 1: AUD/JPY, SELL
In the video: 1:49 · Payout 91%
Why I entered:
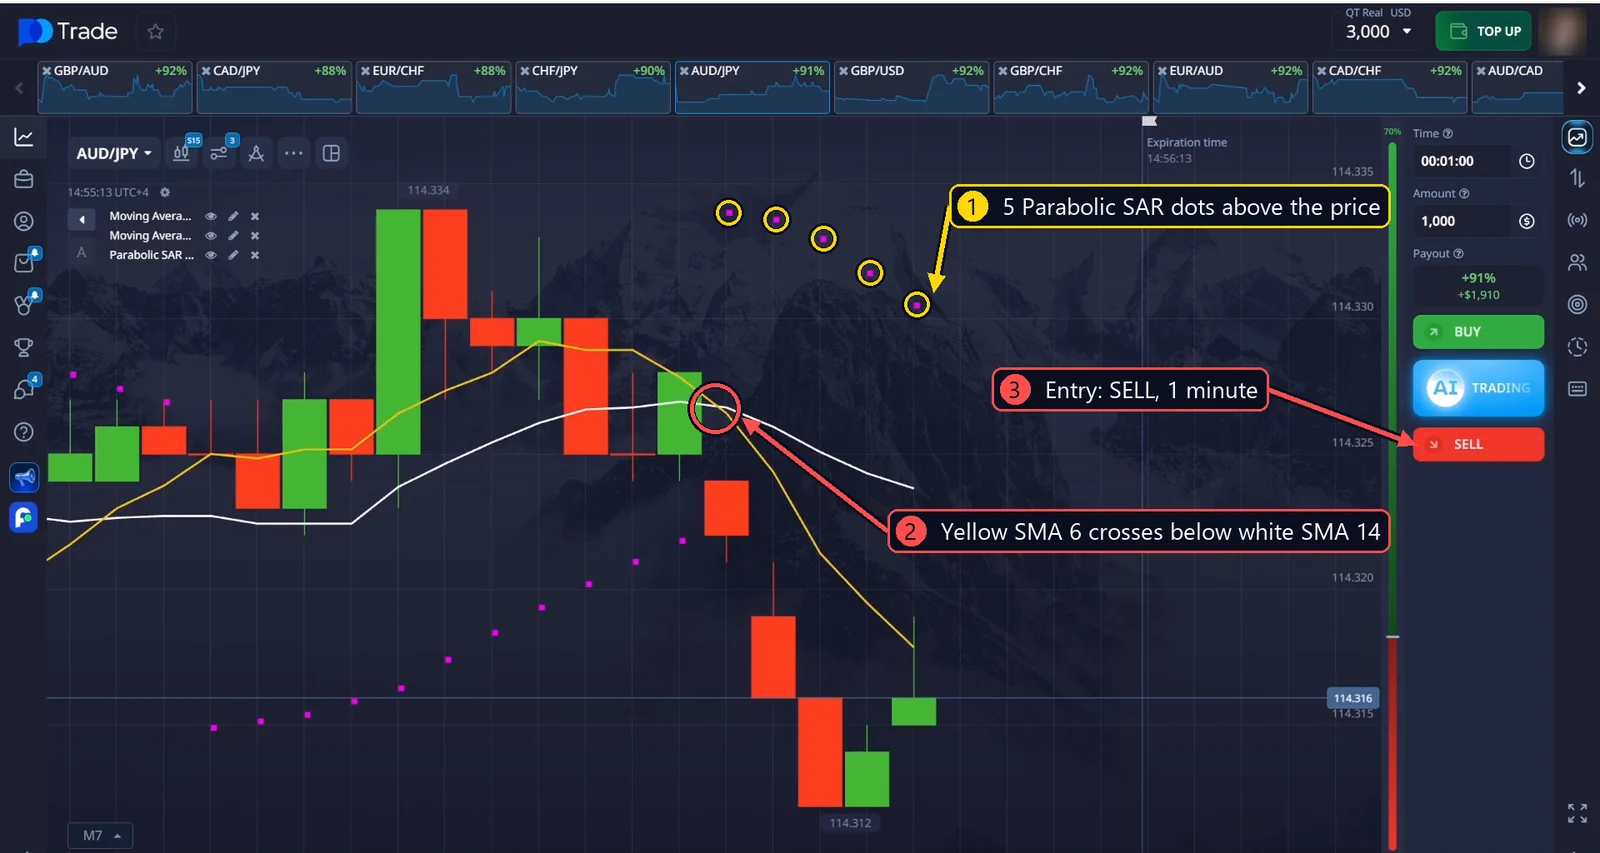
- A downtrend is forming. It is not very strong, but the candles are clearly going lower, and the Parabolic SAR dots have moved above the price. There are 5 of them.
- The yellow SMA 6 has crossed the white SMA 14 from above to below, so the moving averages confirm the signal too.
- Trend, moving averages and Parabolic SAR all point down. I open a SELL for 1 minute.
Result: the trade closed in profit, and quite convincingly.
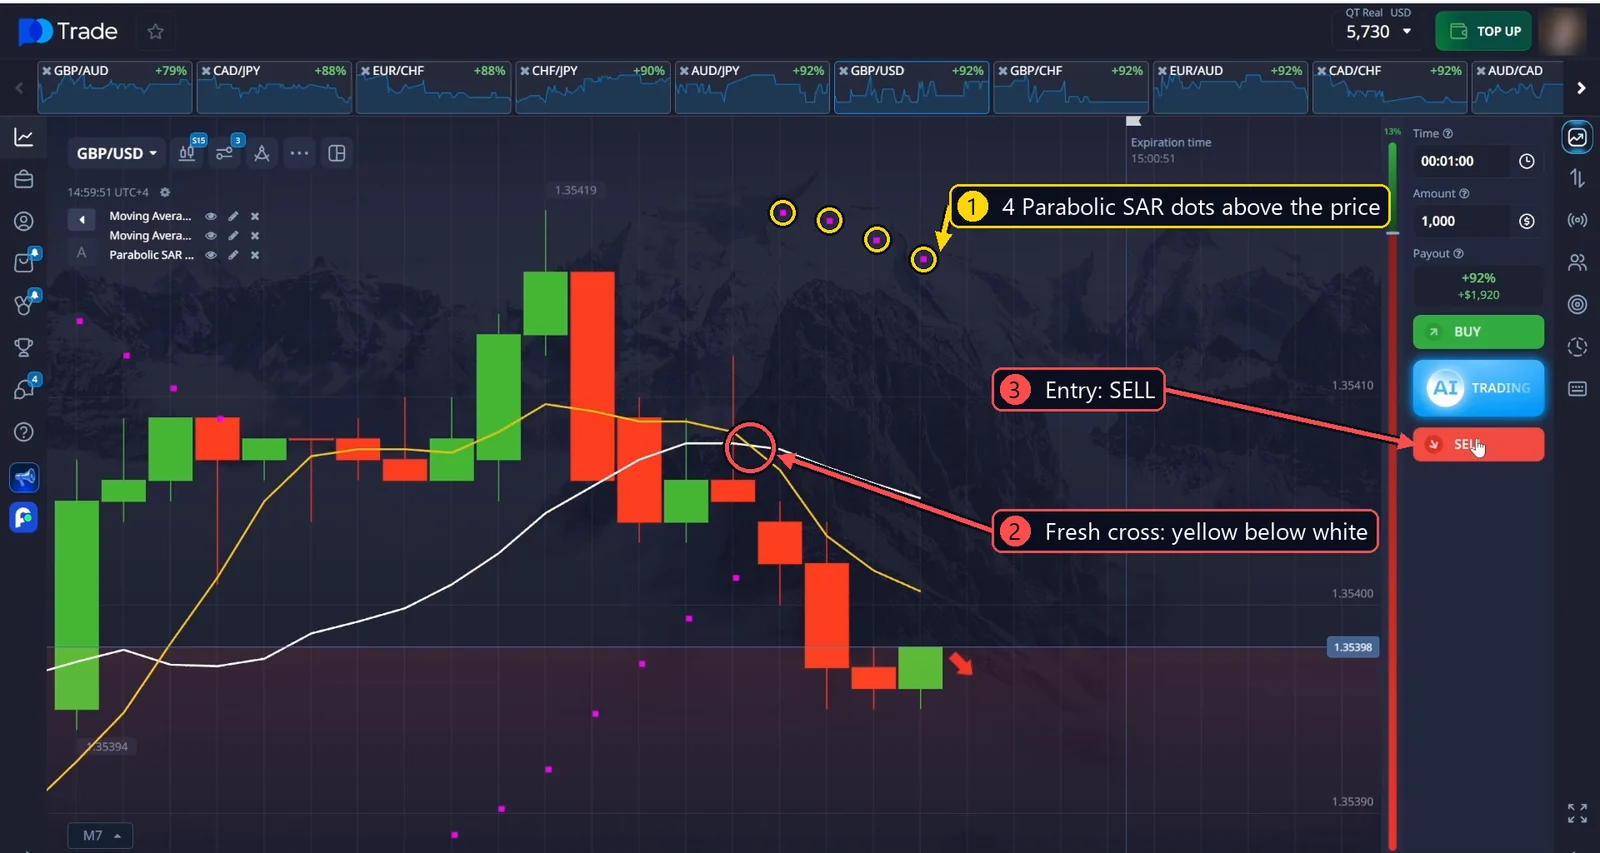
Trade 2: GBP/USD, SELL
In the video: 2:48 · Payout 92%
Why I entered:
- The fall started with one large red candle, and the next candles kept going lower. That keeps the trend alive. Above the price there are 4 Parabolic SAR dots.
- The yellow line has just crossed below the white line. This is the moving average signal I wait for when I want to sell.
- This is not a strong downtrend either. But with this strategy, any downtrend works for me as long as the indicators confirm it together. I open a SELL.
Result: another winning trade.
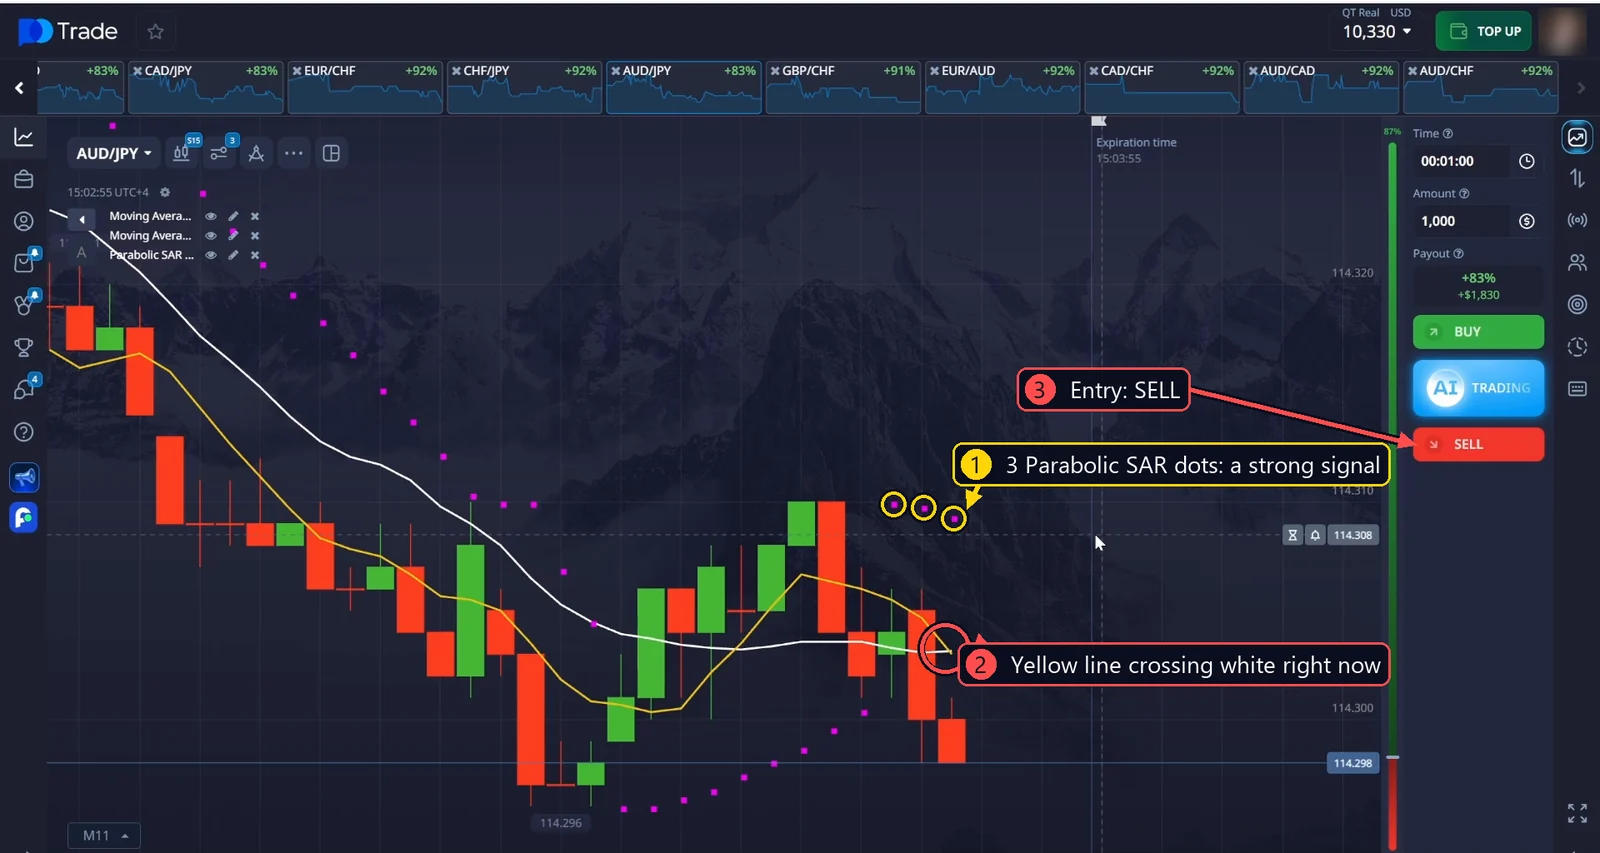
Trade 3: AUD/JPY, SELL
In the video: 3:46 · Payout 83%
Why I entered:
- This pair has a strong downtrend. There were a few small upward corrections, but the red candles keep pushing lower. The Parabolic SAR has just flipped above the price: only 3 dots, so the signal is fresh.
- The yellow line is crossing the white line from top to bottom right now.
- A strong trend plus a fresh crossover plus the Parabolic SAR. These are exactly the factors I look for before choosing a direction. I open a SELL.
Result: a very convincing win, and one I was really happy with.
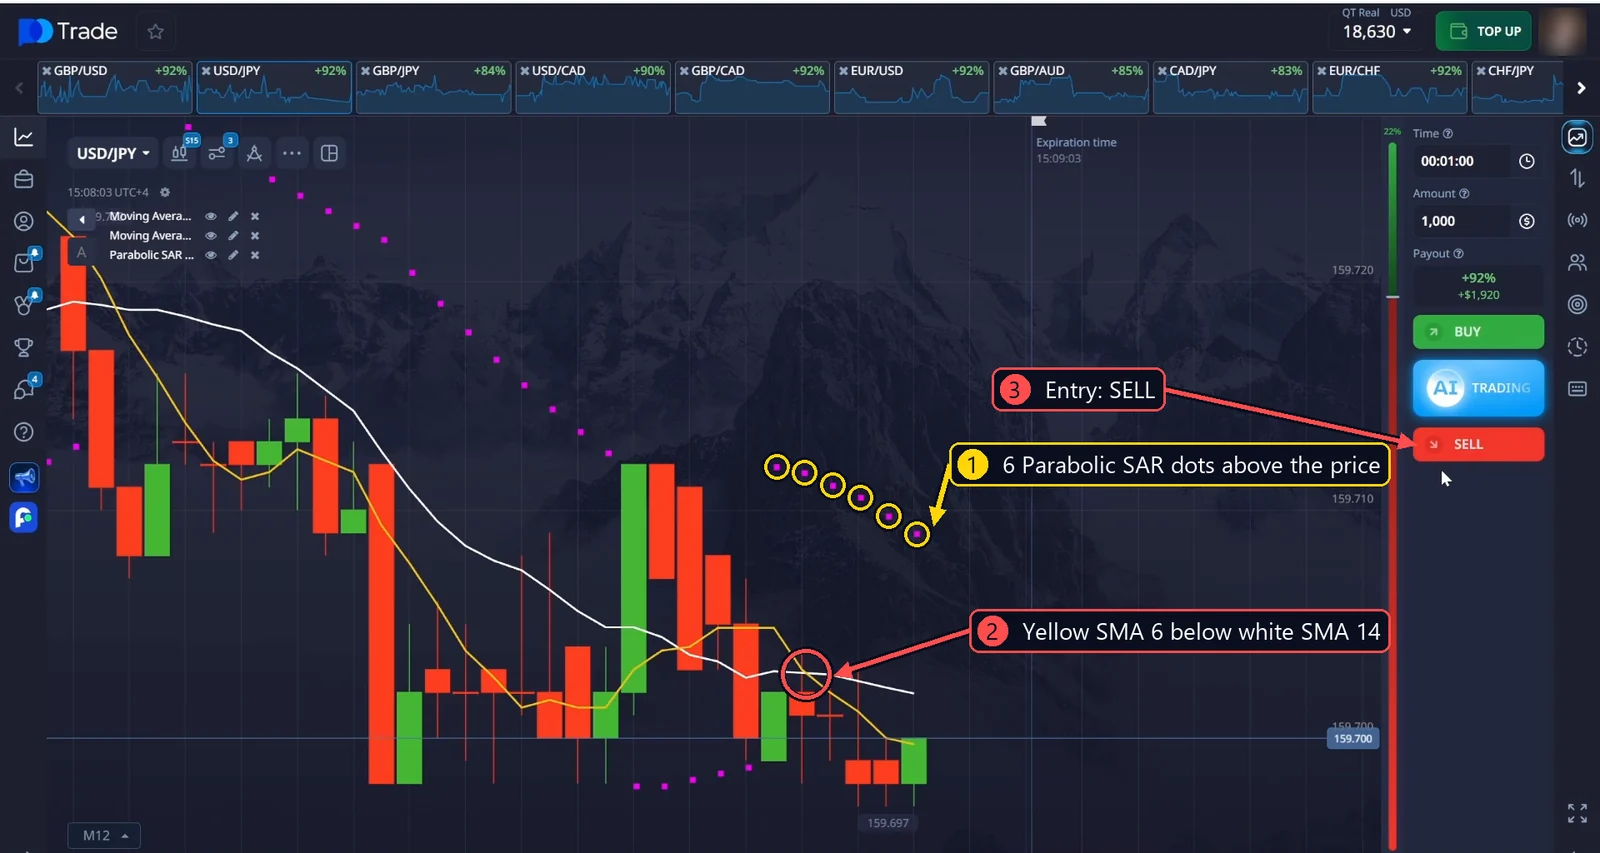
Trade 4: USD/JPY, SELL
In the video: 4:44 · Payout 92%
Why I entered:
- The long-term trend on this pair is down, which I could see straight away. Above the price there are 6 Parabolic SAR dots.
- The yellow line crossed below the white line not long ago. The more recent the crossover, the stronger the signal, so I don’t want to wait much longer and be late.
- Everything agrees again. I open a SELL.
Result: a convincing win. That makes four wins out of four trades in this session.
Watch the full video
Is this strategy 100% accurate?
No, and no strategy ever is. Four out of four is a good session, not a promise. Some days my win rate is higher, some days it is lower. That is simply how short-term trading works.
What helps is having clear rules and sticking to them. Before you trade with real money, test the strategy on a demo account and keep notes. And whatever happens, risk only a small part of your balance on a single trade.
Common mistakes
- Trading against the trend. A crossover against the main direction is the weakest signal on this chart.
- Entering on an old crossover. If the lines crossed many candles ago, you are probably late.
- Trading a sideways chart. When the lines keep crossing back and forth, there is no trend to follow. Wait for a clear direction.
- Using only one indicator. The trend, the moving averages and the Parabolic SAR must all point the same way.
Frequently asked questions
What indicators are used in 1 minute scalping?
Traders use many: moving averages, the Parabolic SAR, RSI, Bollinger Bands and others. In this strategy I keep it to three: a fast SMA 6, a slow SMA 14 and the Parabolic SAR. More indicators don’t mean better signals. On a 1-minute chart, too many of them often disagree and only make the decision harder.
What is the best moving average for scalping?
There is no single best one. For this 1 minute scalping strategy I use two simple moving averages: a fast SMA 6 and a slow SMA 14. The fast line reacts quickly to the price, and the slow line shows the smoother direction. Their crossover gives the signal.
Does the Parabolic SAR work on a 1-minute chart?
Yes, but on its own it gives a lot of signals. That’s why I use it as a confirmation together with the trend and the moving average crossover, not as the only reason to trade.
Why 15-second candles if the trade lasts 1 minute?
Shorter candles show the movement inside that minute. You see the trend and the crossover form earlier, so you can enter on time instead of late.
Is this strategy good for beginners?
The rules are simple, so it is easy to learn. But 1-minute trading is fast and can feel stressful. If you are new, practice on a demo account first until you can follow the rules without hesitating.
The short version
Follow the trend. Wait for the yellow SMA 6 to cross the white SMA 14 in the same direction. Check that the Parabolic SAR agrees. When all three line up, the signal is strong. When one is missing, skip the trade and wait for the next one.
I hope this helps you read the chart a little more clearly. Good luck, and take care of your balance.
I’m Katie. I’ve been trading for more than seven years, and most of my own trading is short-term options like the trades above. More about me.
Remember: trading involves risk. This article is for educational purposes only and is not a recommendation to copy my actions. You alone are responsible for all of your trading decisions.