
Contents (11)
- What is RSI?
- MACD and the Moving Average in simple words
- Setting up the indicators
- The main rule: four signs on a closed candle
- 4 real trades, one sign at a time
- Watch the full video
- When I don’t trade with this strategy
- Is this strategy 100% accurate?
- Common mistakes
- Frequently asked questions
- The short version
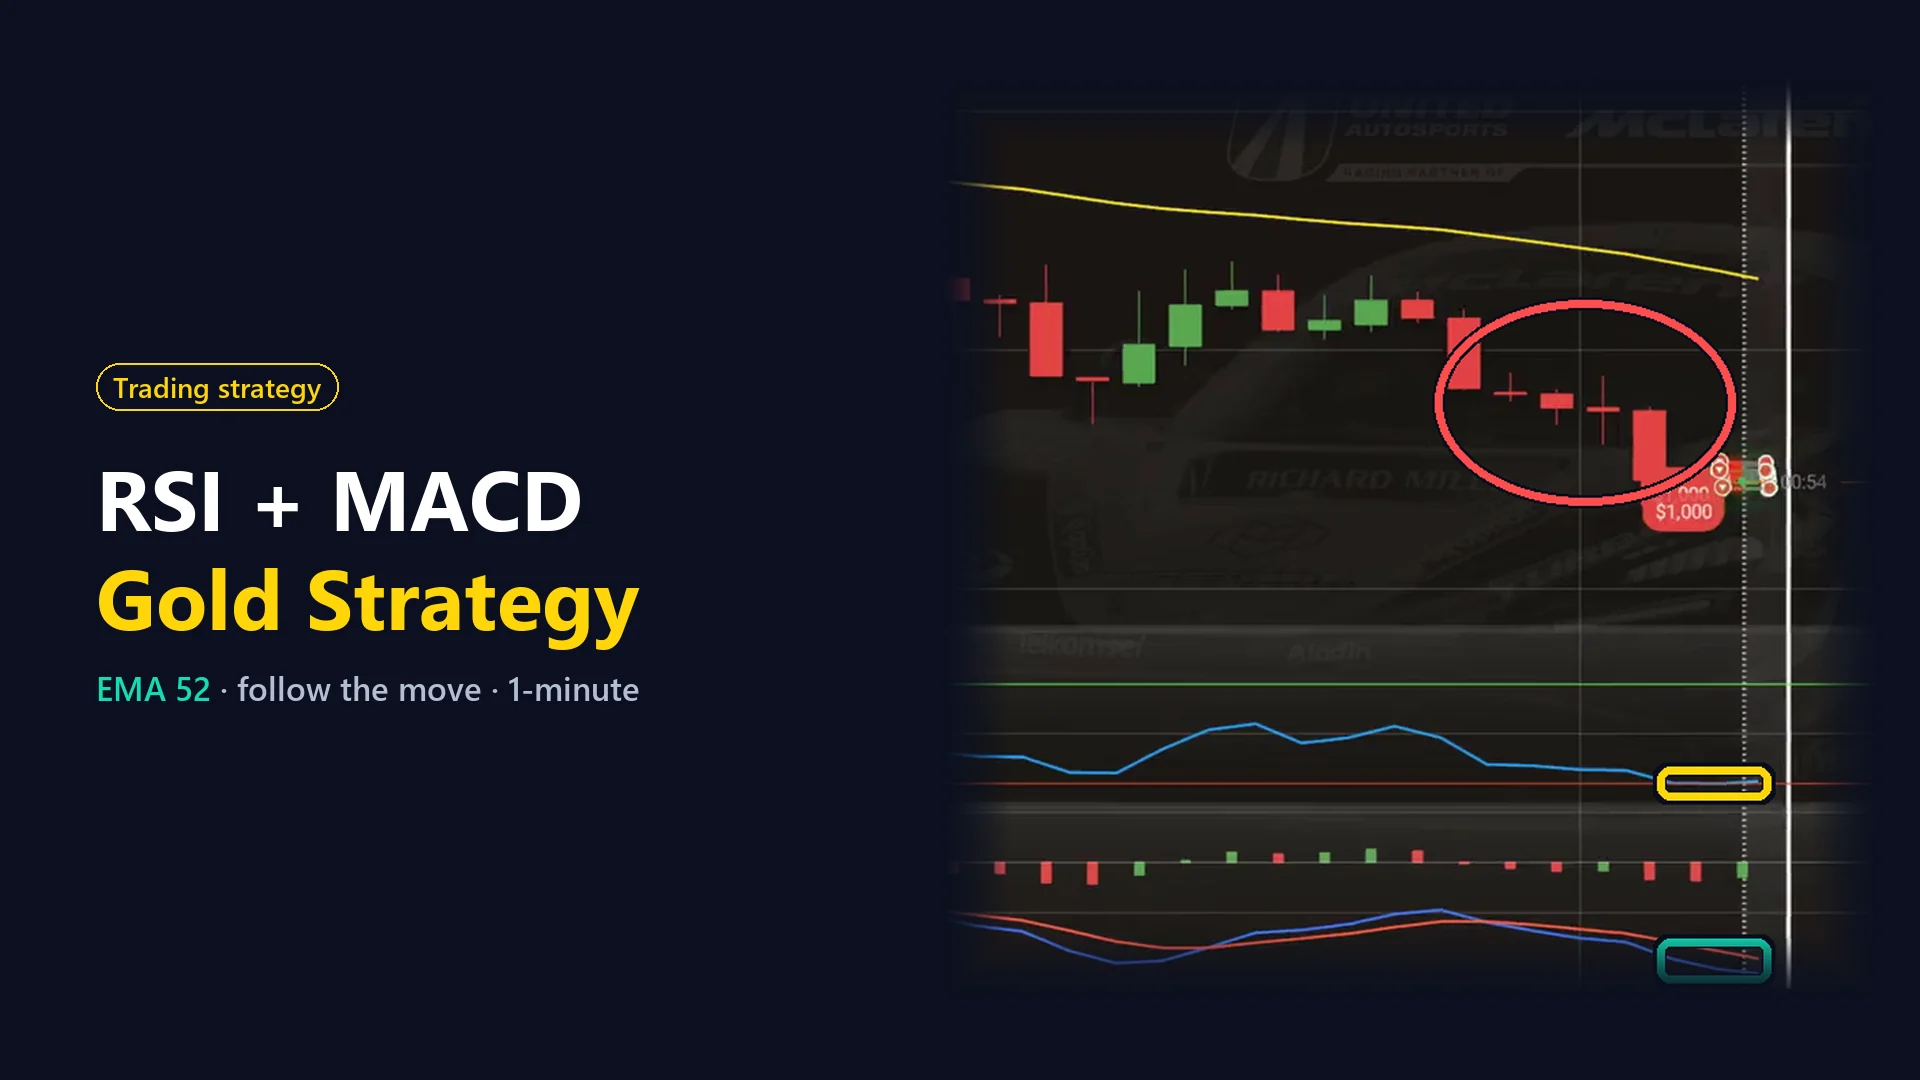
When the RSI line reaches its very top or bottom, many traders expect the price to turn around. In this strategy I don’t wait for that turn. I follow the strong move in the same direction, and I open only at one exact moment: the very start of a new candle. I trade only gold assets and use three indicators, the Moving Average (EMA 52), RSI and MACD, on 1-minute candles, and every position is open for 1 minute.
Below I explain each indicator in simple words, my settings and the exact rule with four signs. Then I show you all 4 trades from my video, screenshot by screenshot. Each trade looks closely at one sign, and in the last one you see all four together. All 4 closed in profit that day, but that is one good session, not a promise.
What is RSI?
RSI (Relative Strength Index) was created by J. Welles Wilder. It compares the recent rises with the recent falls and shows the result as a line from 0 to 100.
- The default setting is period 14, with levels at 70 and 30.
- Above the upper level, the buyers have pushed hard. Below the lower level, the sellers have pushed hard.
- Many traders read these levels as a sign that the price will soon turn around.
- But in a strong move, the line can stay near its top or bottom for a long time.
In this method I use RSI differently. With period 8, it looks only at the last 8 candles, so it reacts fast. And instead of 70 and 30, I use 90 and 10, so only very strong moves reach them. When the blue line closes at 90 or 10, I don’t bet on a turn. I go with the move.
MACD and the Moving Average in simple words
MACD was created by Gerald Appel. It has two lines, and in my method I only watch these two lines:
- The blue MACD line is the difference between a fast average and a slow average of the price. In my settings, a fast average of 8 candles and a slow one of 17.
- The red signal line is an average of the blue line itself, over 5 candles.
- When blue is above red, the push up is stronger than a moment ago. When blue is below red, the push down is stronger.
- The default setting is 12, 26 and 9. The small bars under the lines are the histogram, which I don’t use here.
The Moving Average is the well-known line that follows the average price. Its line shows me the side of the bigger move. There are two common types:
- SMA (simple) gives every candle the same weight. On my platform the default is SMA with period 14.
- EMA (exponential) gives more weight to the newest candles, so it reacts a little faster. I use EMA 52: the average of the last 52 candles, where the newest ones count a little more.
Put simply: the yellow line shows the side of the bigger move, the candles show that the move is strong right now, RSI shows that the push is very strong, and MACD shows that the push is still growing. I need all four on the same closed candle.
Setting up the indicators
First is the Moving Average. I change the period from 14 to 52 and the type from SMA to EMA. Then I choose yellow, thicken the line and save.
The second indicator is RSI. I lower the period from 14 to 8. Then I move the top level (Overbought) from 70 to 90 and the bottom one (Oversold) from 30 to 10. I change the purple line to blue and thicken it, keep the green and red levels, and save.
The third and last indicator is MACD. I change the periods from 12 to 8, from 26 to 17 and from 9 to 5, so the lines react faster. Then I change the orange signal line to red, keep the MACD line blue, thicken both lines and save.
Then I choose 1-minute Japanese candles, change the trading time from 2 minutes to 1 minute and set the time scale of the chart to 30 minutes.
| Indicator / setting | Value | Color |
|---|---|---|
| Moving Average | Period 52, type EMA (default 14, SMA) | Yellow, thick line |
| RSI | Period 8, Overbought 90, Oversold 10 (default 14, 70, 30) | Blue, thick line, green and red levels |
| MACD | 8, 17, 5 (default 12, 26, 9) | MACD line blue, signal line red, both thick |
| Candles | 1 minute, Japanese | |
| Trade duration | 1 minute | |
| Chart time scale | 30 minutes |
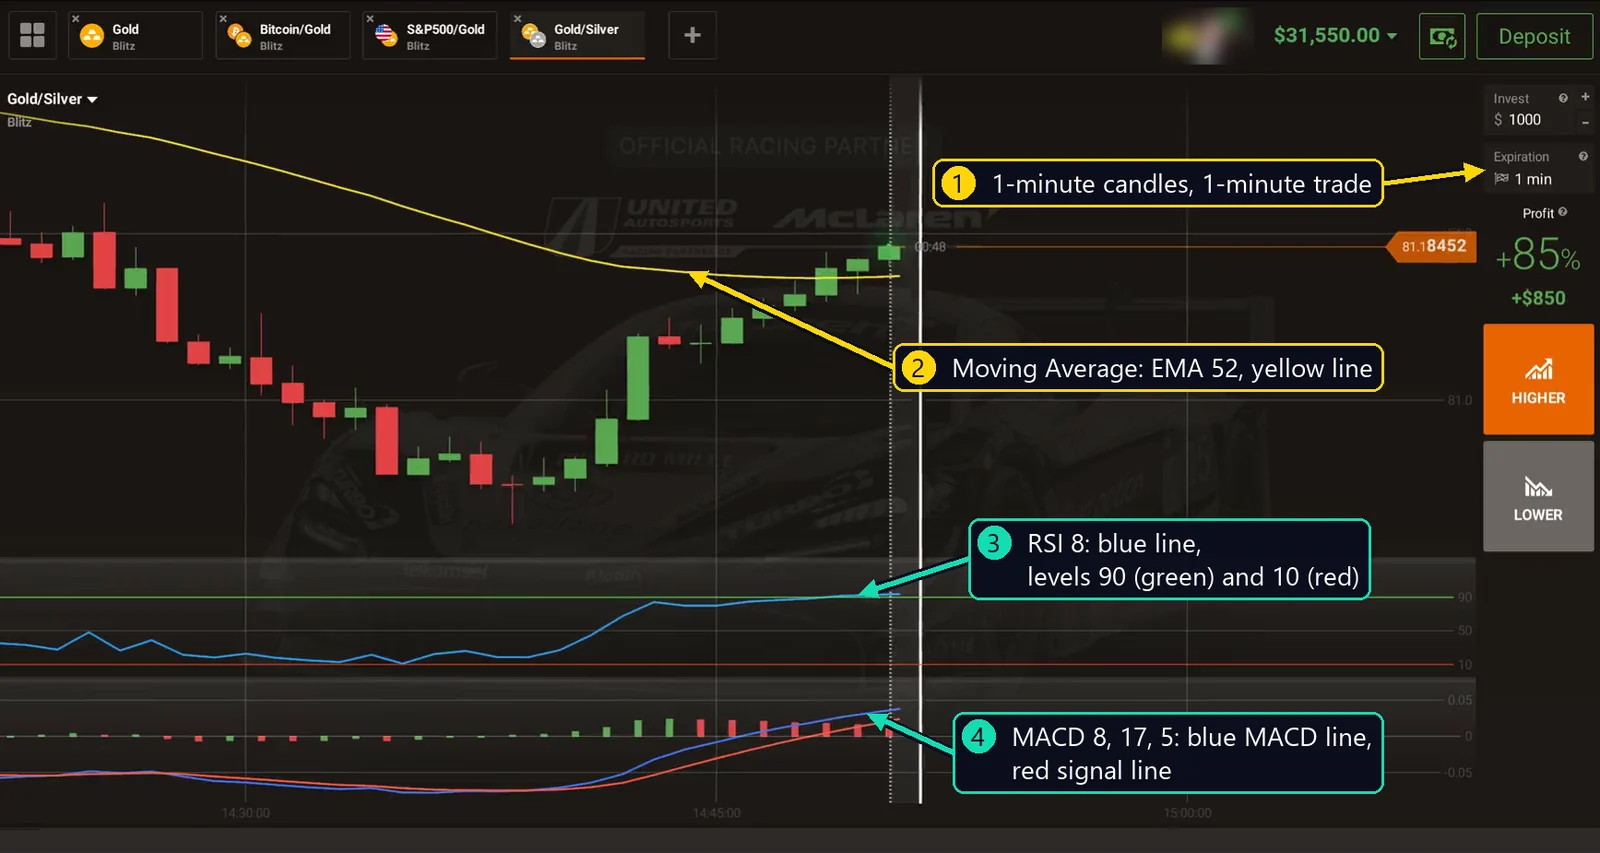
Next, I add gold assets with a high payout to the top bar. There are four of them, and every one is a gold asset: Gold, Bitcoin/Gold, S&P500/Gold and Gold/Silver. This way I can switch between them quickly and check each chart.
The main rule: four signs on a closed candle
For a position down, all four must be true on the same closed candle:
- Candles: at least three red candles in a row.
- Moving Average: the candle closes below the yellow EMA 52 line.
- RSI: the blue line closes at 10 or lower.
- MACD: the blue line is below the red signal line.
For a position up, everything is the other way around: at least three green candles in a row, a close above the yellow line, RSI at 90 or higher, and the blue MACD line above the red one. I always wait for the candle to close and open every position at the very start of the next candle, for 1 minute.
Why I wait for the close and need all four signs
Inside a candle, RSI can touch its level and come back. So only a closed candle counts. One red candle can be a random jump, but three in a row show that the sellers kept control.
Each sign filters the others. Three red candles alone can appear in a calm market, and RSI at 10 alone can come after one sharp candle. Together with the yellow line and MACD, they show me one strong move that still has strength.
When the signals say no
Here is a real moment from the same session, right before my first trade, on Gold/Silver. The price had climbed far above the yellow line, and the blue RSI line had touched 90. But a few seconds before the close, the last candle turned big and red, and RSI was already falling back toward the middle.
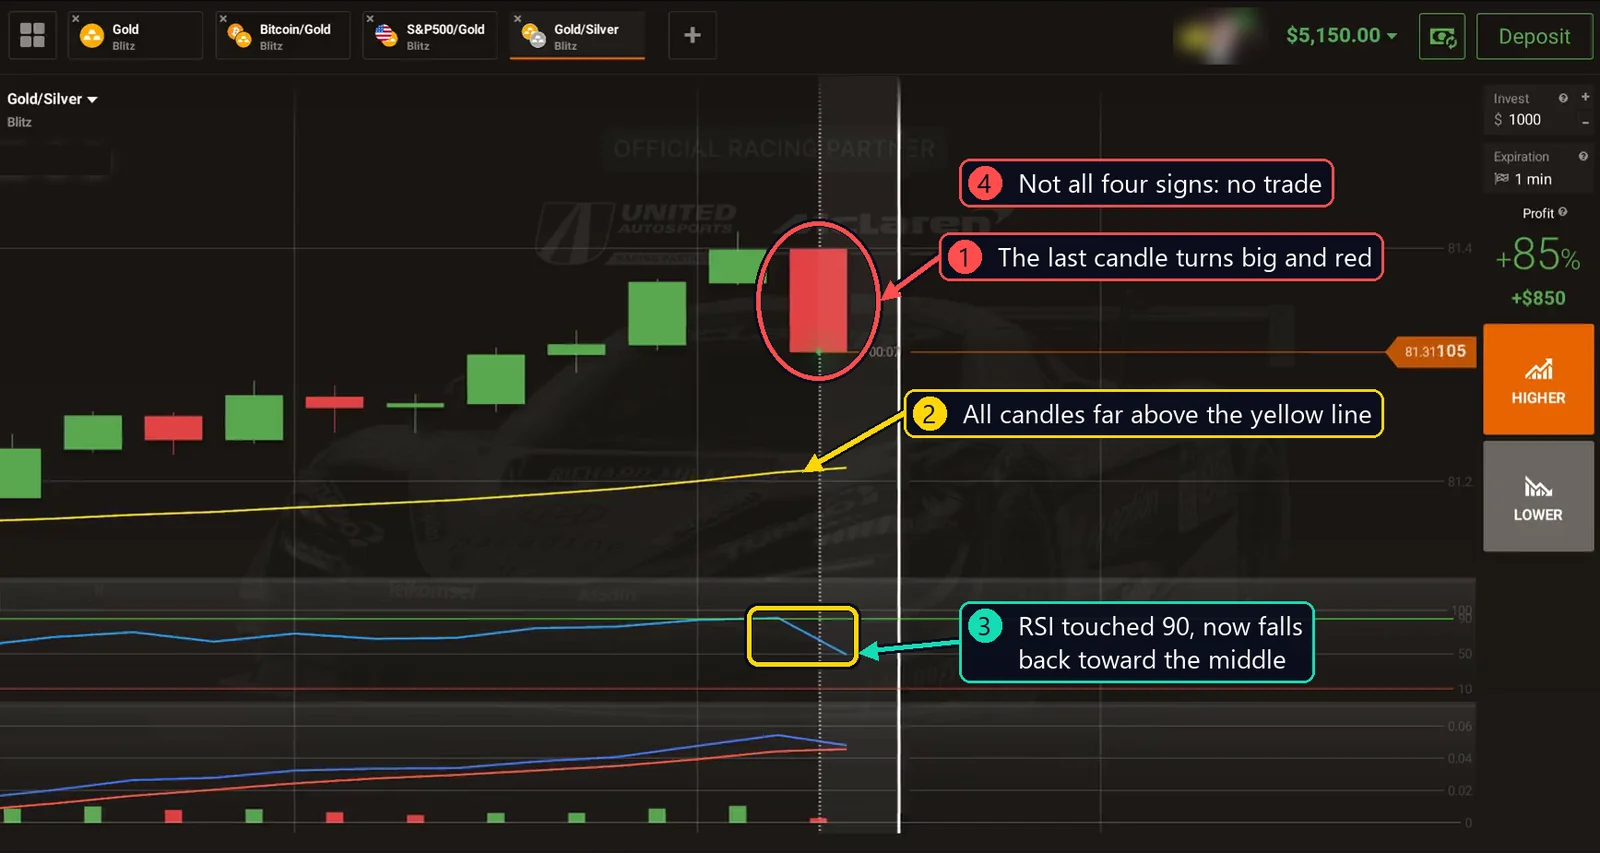
For a position up, I need the last three candles green and RSI at 90 or higher at the close. For a position down, the candle must close below the yellow line, and here it is far above it. Not all four signs agree, so I don’t open anything. Not opening a position is also a decision.
Quick checklist
| Position down | Position up | |
|---|---|---|
| Candles | At least three red in a row | At least three green in a row |
| Moving Average (EMA 52) | Close below the yellow line | Close above the yellow line |
| RSI (8) | Blue line at 10 or lower | Blue line at 90 or higher |
| MACD (8, 17, 5) | Blue line below the red one | Blue line above the red one |
| Entry | After the close, at the very start of the next candle | |
| Duration | 1 minute | 1 minute |
4 real trades, one sign at a time
Here is the whole session. I traded only gold assets. Every trade lasted 1 minute, and each time I opened several positions at the start of the new candle.
| # | Asset | Direction | Payout | Positions | Result |
|---|---|---|---|---|---|
| 1 | Bitcoin/Gold | Down | 86% | 5 | Win |
| 2 | S&P500/Gold | Down | 85% | 9 | Win |
| 3 | Gold/Silver | Up | 85% | 17 | Win |
| 4 | Bitcoin/Gold | Down | 86% | 19 | Win |
Each screenshot was taken a few seconds after my entry, when all positions were already open. The numbers on the arrows match the explanation under the picture.
Trade 1: Bitcoin/Gold, down, with every candle below the yellow line
In the video: 2:02 · Payout 86%
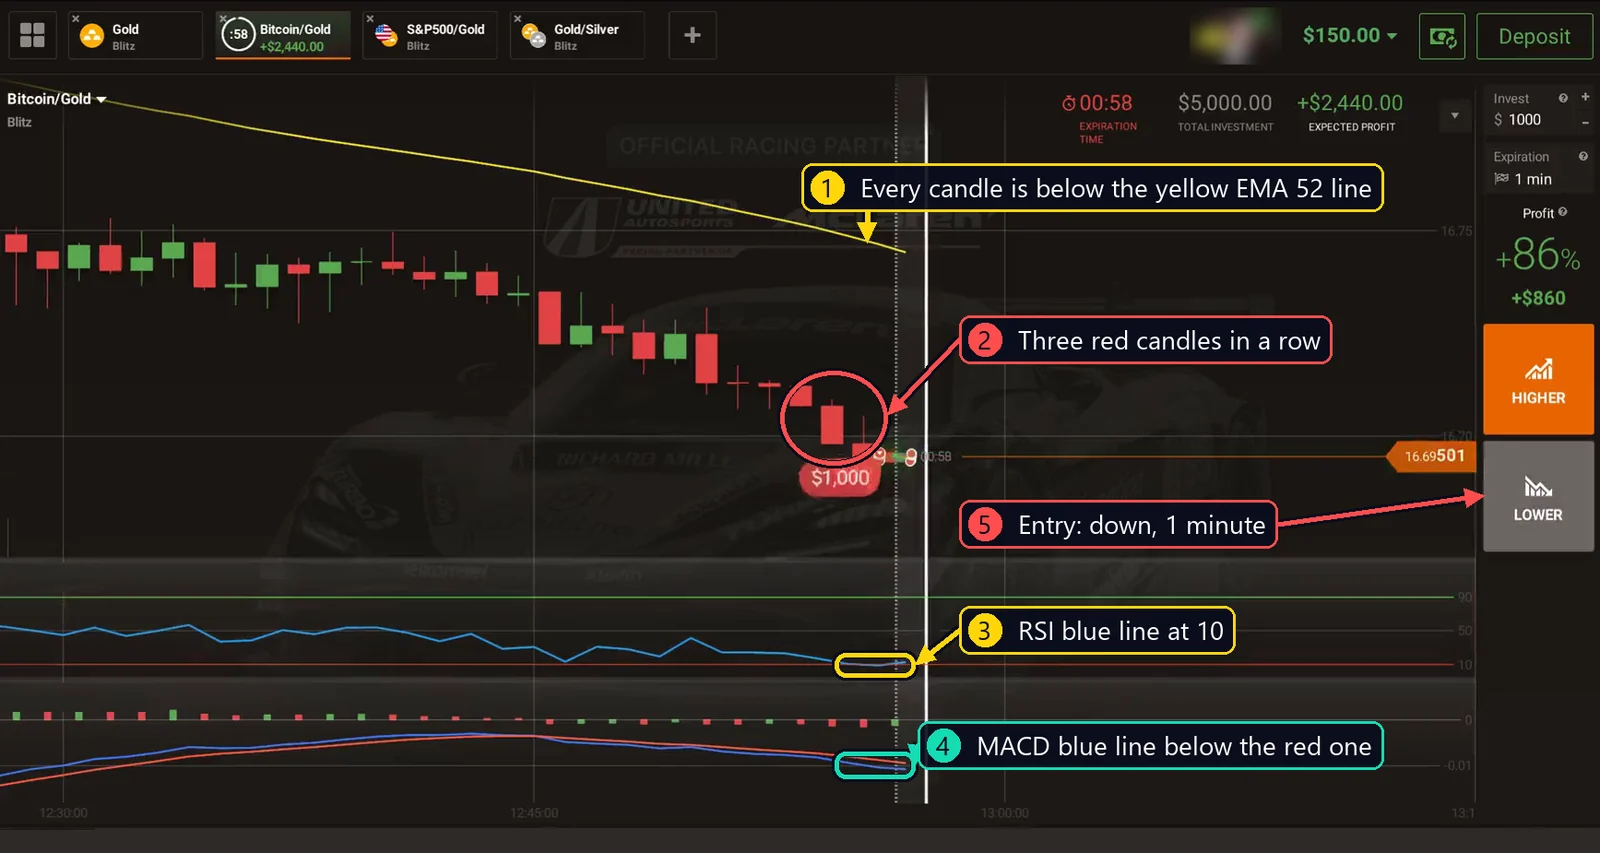
In the first trade, let’s look closely at the yellow Moving Average line. I waited for the red candle to close, and at the start of the next one, I opened a few positions down.
Why I entered:
- Every candle on the chart is below the yellow EMA 52 line, so the bigger move was clearly down. My candle had to close below this line, and it did.
- The last three candles were all red.
- The blue RSI line closed at 10.
- The blue MACD line is below the red one.
- I open positions down for 1 minute.
Result: after I opened, the new candle was green at first and stood just above my line. Then it turned red and slipped a little below my line, and the first trade ended in profit.
Trade 2: S&P500/Gold, down, when RSI reached 10
In the video: 3:14 · Payout 85%
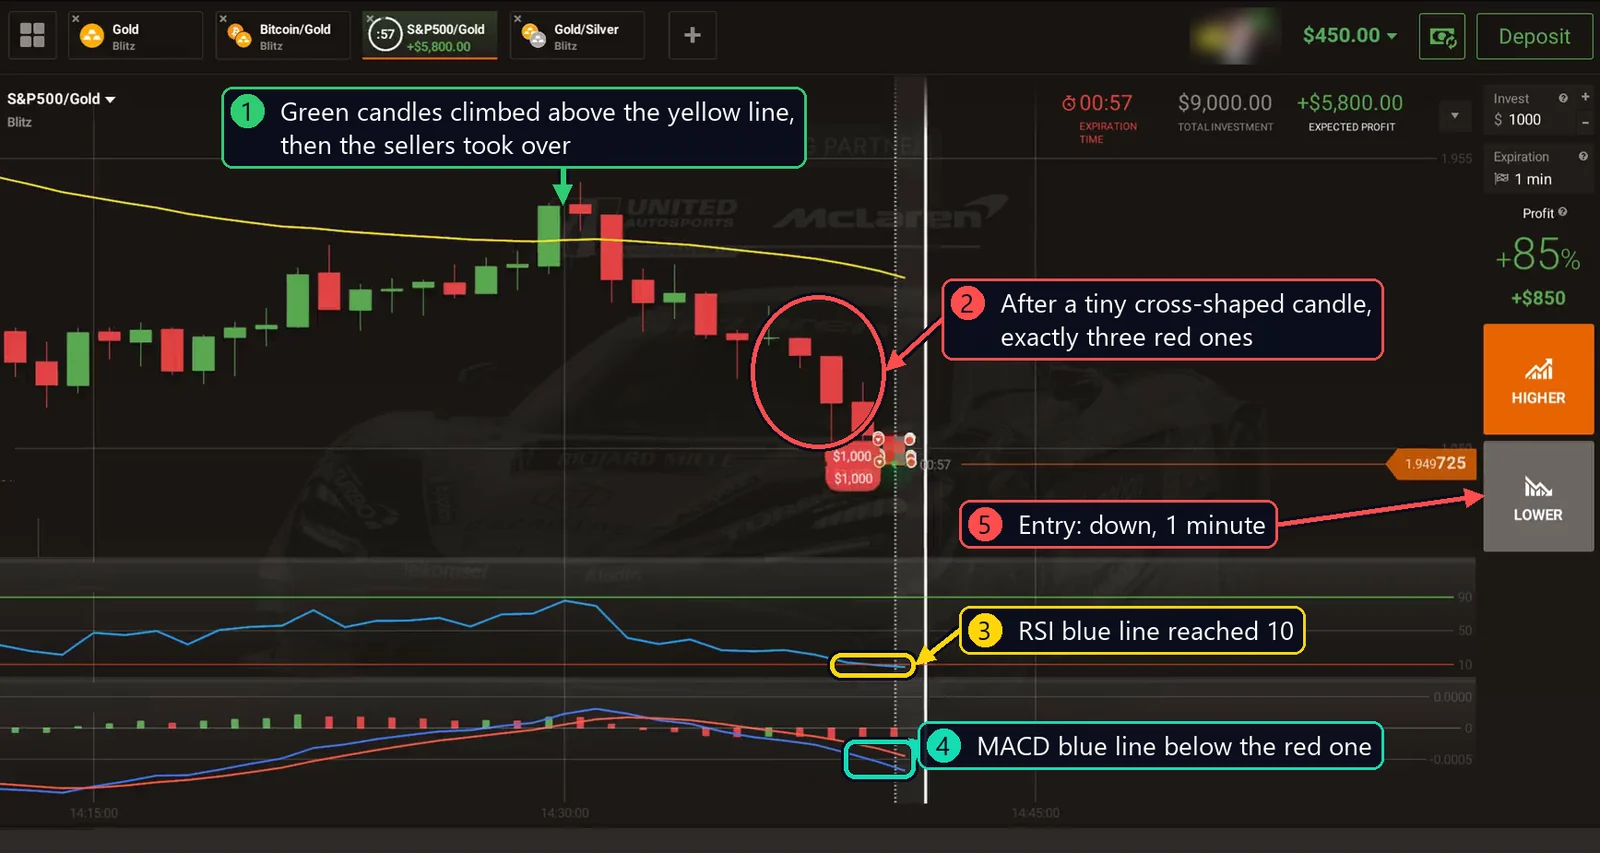
This chart looked very different from the first one, and this trade is about RSI. I waited for the close, and in the first seconds of the new candle, I opened a few positions down.
Why I entered:
- Here the green candles first climbed above the yellow line, then the sellers took over.
- After a tiny cross-shaped candle, exactly three red ones came down, the minimum for this method. The last one closed below the yellow line.
- At the close, the blue RSI line reached 10. At 11, I wouldn’t open.
- The blue MACD line is below the red one.
- I open positions down for 1 minute.
Result: after I opened, the candle stayed small for a long time, next to my lines. Then it stretched down into a long red candle. The second win in a row.
Trade 3: Gold/Silver, up, with the MACD lines
In the video: 4:25 · Payout 85%
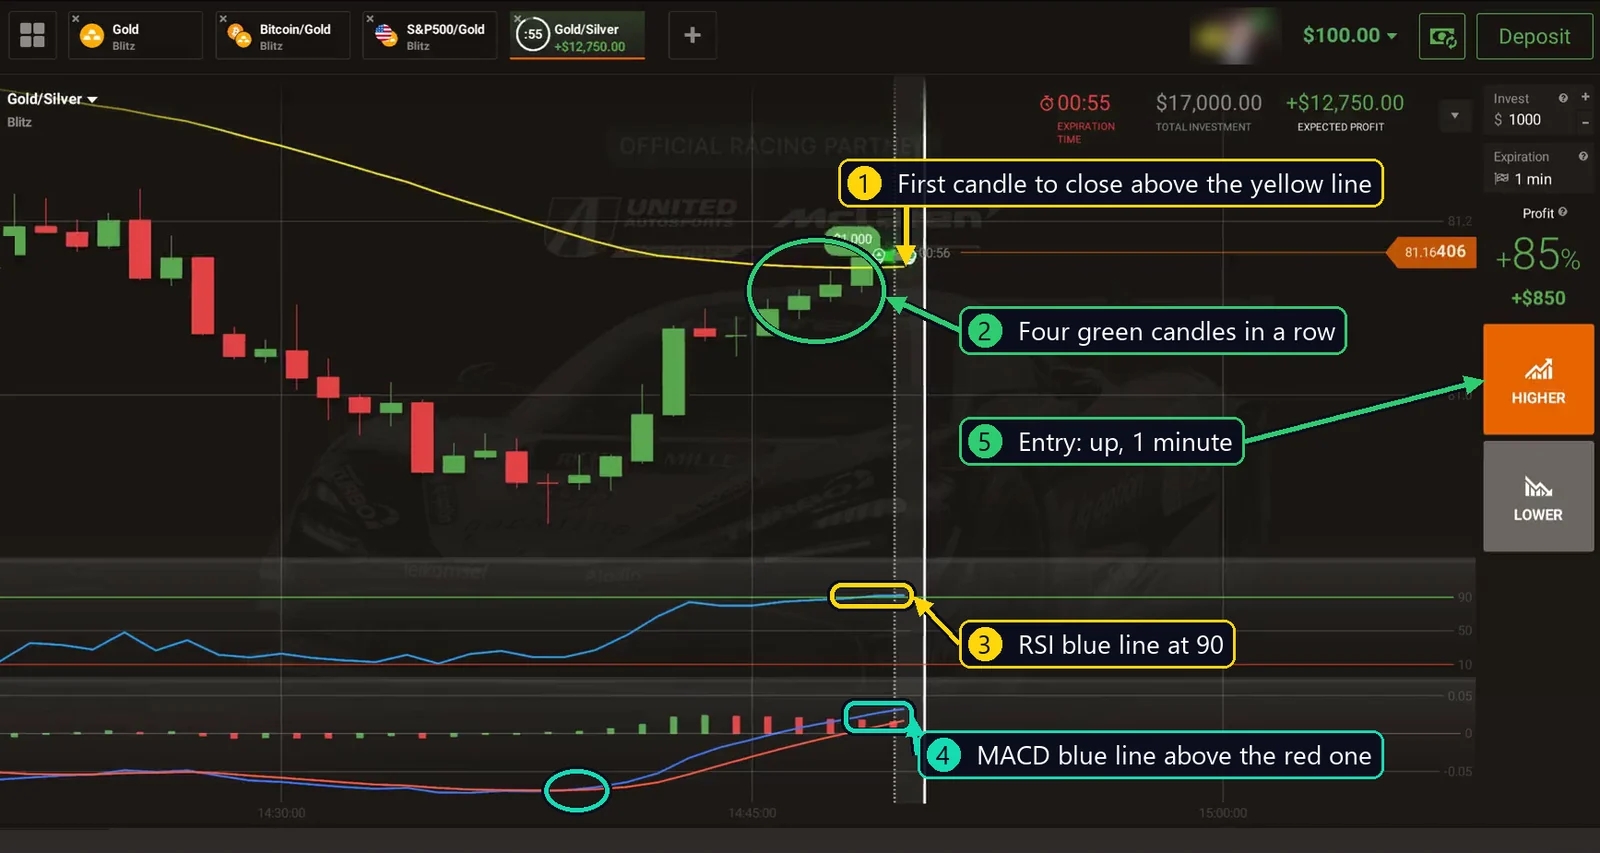
Now a position up, so everything is the other way around. The candles first fell far below the yellow line, then climbed back step by step. This trade is about MACD.
Why I entered:
- My candle was the first to close above the yellow line.
- Four green candles in a row, one more than I need.
- The blue RSI line had climbed to 90.
- The blue MACD line is above the red one. The two lines had crossed upward near the bottom (the circle on the left), and blue stayed above all the way.
- I open positions up for 1 minute.
Result: twenty seconds in, the candle turned red for a moment, and RSI dropped below 90. A few seconds later, the candle was green again, just above my line, and the third trade closed in profit too.
Trade 4: Bitcoin/Gold, down, with all four signs together
In the video: 5:40 · Payout 86%
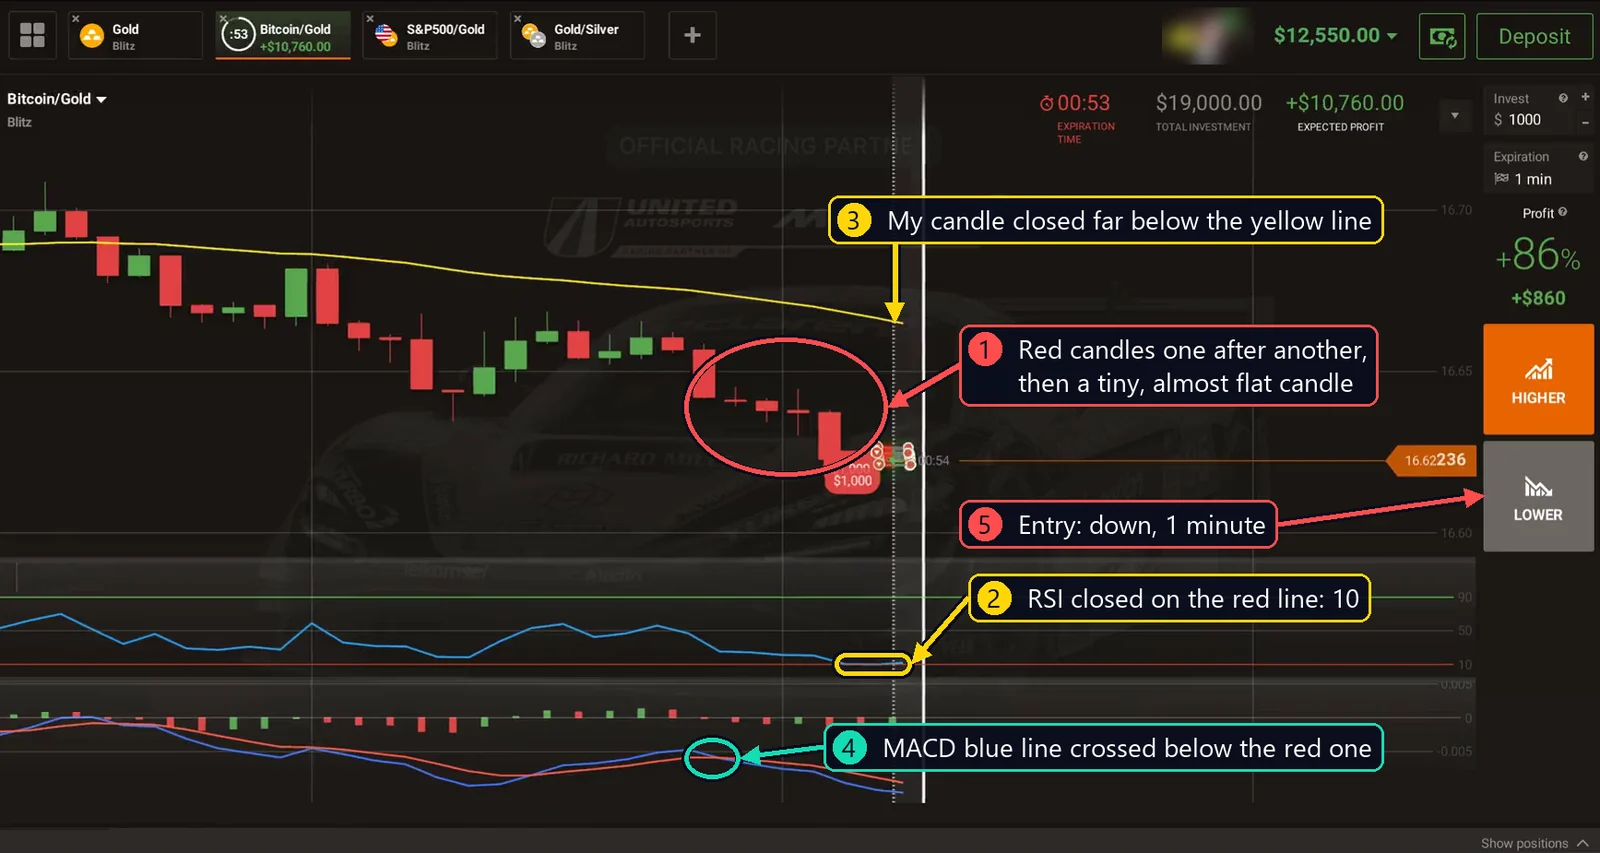
In the last trade, let’s put all four signs together. I switched to this chart a few seconds before the candle closed, but I still waited for the close, and at the start of the next candle, I opened a few positions down.
Why I entered:
- Candles: red ones came down one after another, and right before my entry came a tiny candle, almost a flat line.
- RSI: the blue line closed right on the red line at 10.
- Moving Average: my candle closed far below the yellow line.
- MACD: the blue line had crossed below the red one a few candles earlier.
- I open positions down for 1 minute.
Result: after I opened, the candle stayed small and red, just below my lines. Four wins out of four.
One detail I noticed in all four trades: during the whole minute, the RSI line never went back toward the middle. It moved only a little away from its level and then came back. For me, that showed the move still had strength.
Watch the full video
When I don’t trade with this strategy
The hardest part of this method is waiting. I skip the moment when:
- there are fewer than three candles of the same color in a row,
- the candle closes on the wrong side of the yellow line,
- RSI closes at 11 instead of 10, or at 89 instead of 90,
- the blue MACD line is on the wrong side of the red one,
- the candle hasn’t closed yet, because inside a candle RSI can touch its level and come back,
- I missed the start of the new candle. Then I wait for the next moment.
If even one sign is missing, I simply wait.
Is this strategy 100% accurate?
No. No method wins every time, and losses are part of trading. Four out of four is my result from one session, not a promise.
It helps to know your numbers. With a payout of 86% or 85%, you need to win about 54 trades out of 100 just to break even. You can check this for your own payout with my break-even win rate calculator.
And I want to be honest with you about the balance. In the first three trades I put almost my whole balance in, and in the last one more than half of it. That is very risky, even if it looks exciting. One loss, and most of it would be gone. Never risk money you can’t afford to lose. Risk only a small part of your balance on a single trade, test the strategy on a demo account first and keep a trading journal.
Common mistakes
- Opening before the candle closes. Inside a candle, RSI can touch 90 or 10 and come back. Only a closed candle counts.
- Trading against the move. In this method, RSI at 90 or 10 shows strength, not a turn. I open in the same direction as the move.
- Trusting one sign alone. Three red candles can appear in a calm market, and RSI at 10 can come after one sharp candle. I need all four.
- Rushing and trading on emotions. If I miss the moment, I don’t chase it. I wait for the next one.
Frequently asked questions
Should you use RSI and MACD together?
They do different jobs, so they work well together. RSI shows how strong the push is on a scale from 0 to 100. MACD shows whether the push is still growing or already fading. In my method, they also have to agree with the candles and the yellow line.
Which is better, RSI or MACD?
Neither is better alone. RSI reacts fast and shows when a move is stretched. MACD is built from moving averages, so its lines are smoother and a little slower. That’s why I use both: each one filters the other.
Is RSI above 90 a signal to sell?
Many traders read a high RSI as a sign that the price will fall soon. But in a strong move, RSI can stay high for a long time. In this method, RSI at 90 is one of the signs for a position up, and only together with the other three.
What are the best RSI settings for 1-minute trading?
The default is period 14 with levels 70 and 30. On 1-minute candles I use period 8 with levels 90 and 10. The shorter period makes RSI react faster, and the higher levels leave only very strong moves. There is no single best setting for everyone, so test the settings you choose on a demo account first.
What is the difference between EMA and SMA?
Both are moving averages. SMA gives every candle in the period the same weight. EMA gives more weight to the newest candles, so it follows the price a little faster. On my platform the Moving Average starts as SMA 14, and I change it to EMA 52.
The short version
Trade gold assets on 1-minute candles. For a position down, wait for at least three red candles in a row, a close below the yellow EMA 52 line, RSI at 10 or lower and the blue MACD line below the red one. For a position up, everything is the other way around, with RSI at 90 or higher. Wait for the candle to close and open at the very start of the next one, for 1 minute. When one sign is missing, skip it and wait.
If you like following the trend, look at my 1 minute scalping strategy or the Parabolic SAR and EMA crossover strategy. If you prefer to trade the turn, try my Williams %R reversal strategy. I wish you very, very successful trading days.
I’m Katie. I’ve been trading for more than seven years, and most of my own trading is short-term options like the trades above. More about me.
Remember: trading involves risk. This article is for educational purposes only and is not a recommendation to copy my actions. You alone are responsible for all of your trading decisions.