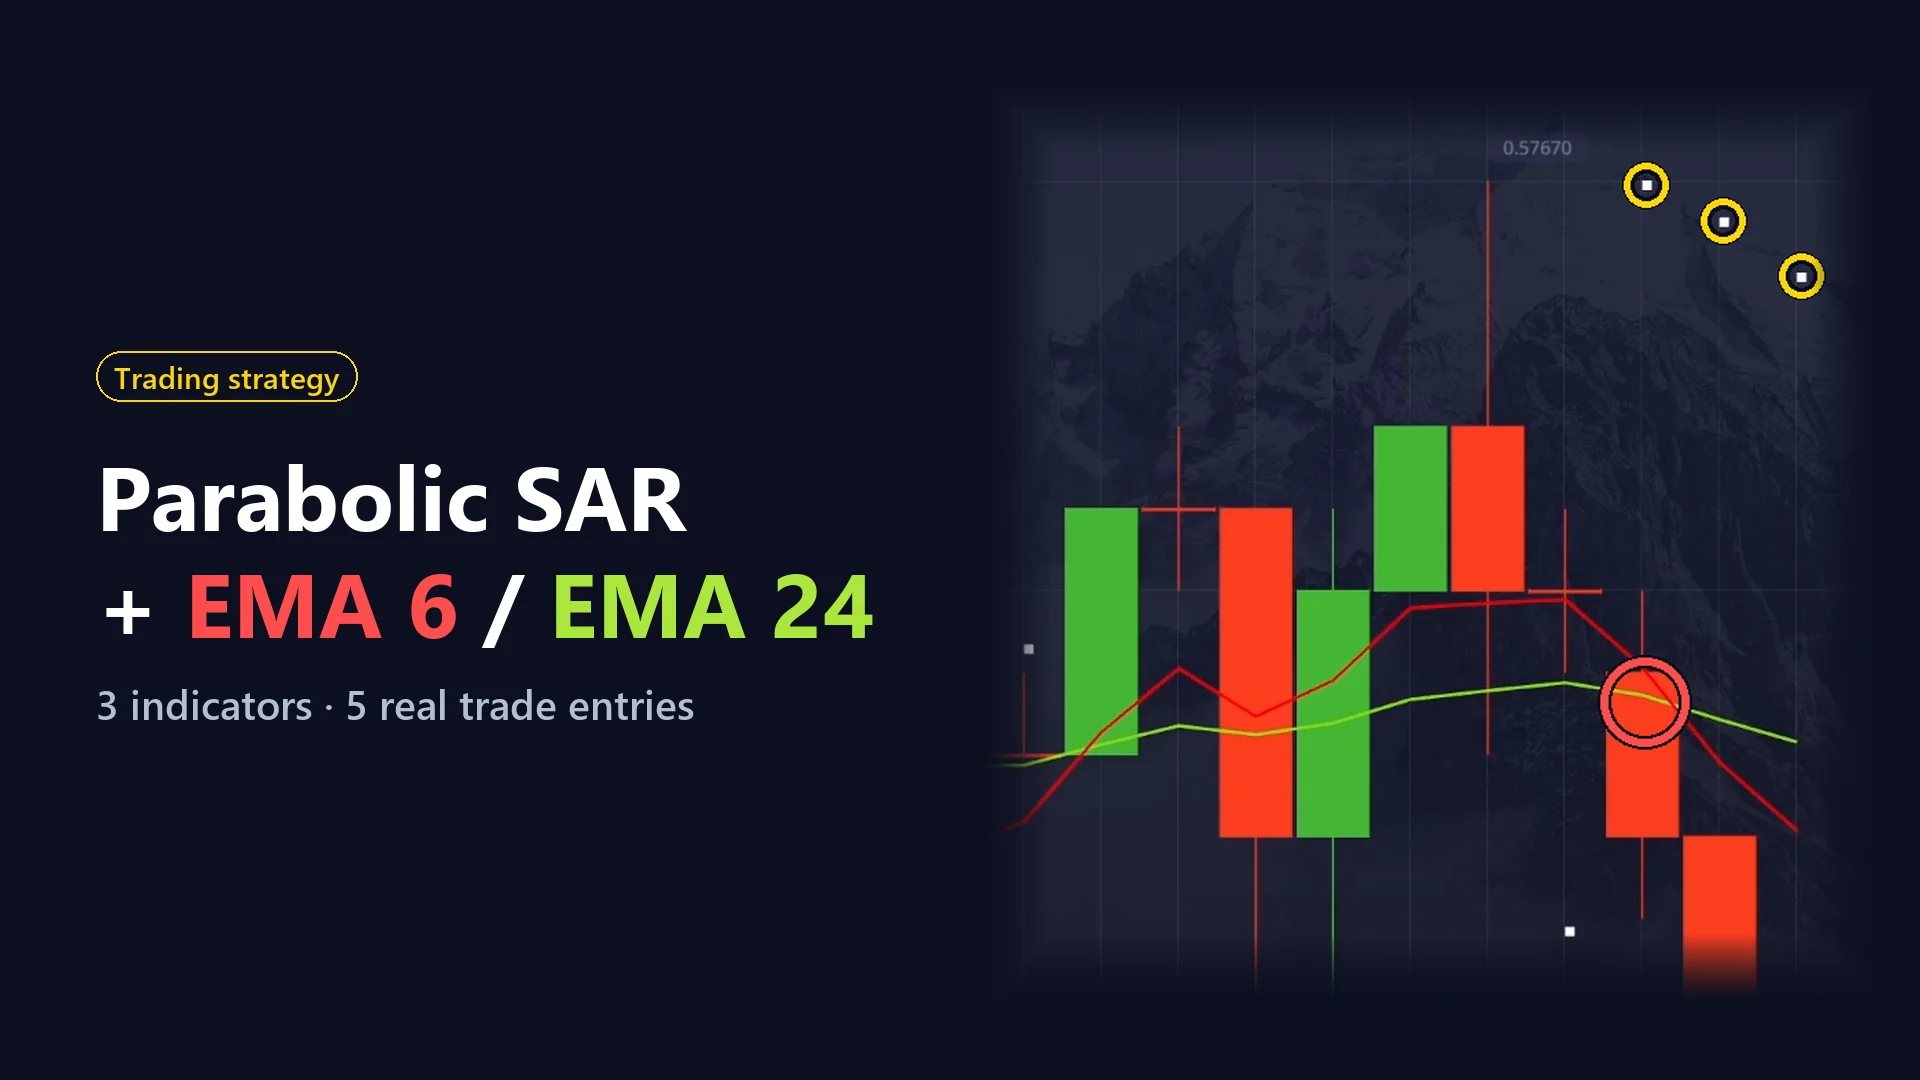
In this article, I’ll walk you through the method I’ve been using most often lately. It’s built on three simple indicators that every trader knows: the Parabolic SAR and two exponential moving averages (EMAs). None of them is anything special on its own, but together they filter signals remarkably well. In the video this article is based on, the balance grew from $4,000 to $36,080.
Below, I’ll show you step by step how I set up the indicators and which rules I follow. The most important part, though, is the five real trades: on each screenshot, I’ve used arrows to show what I saw on the chart and why I entered.
1. Setting Up the Indicators
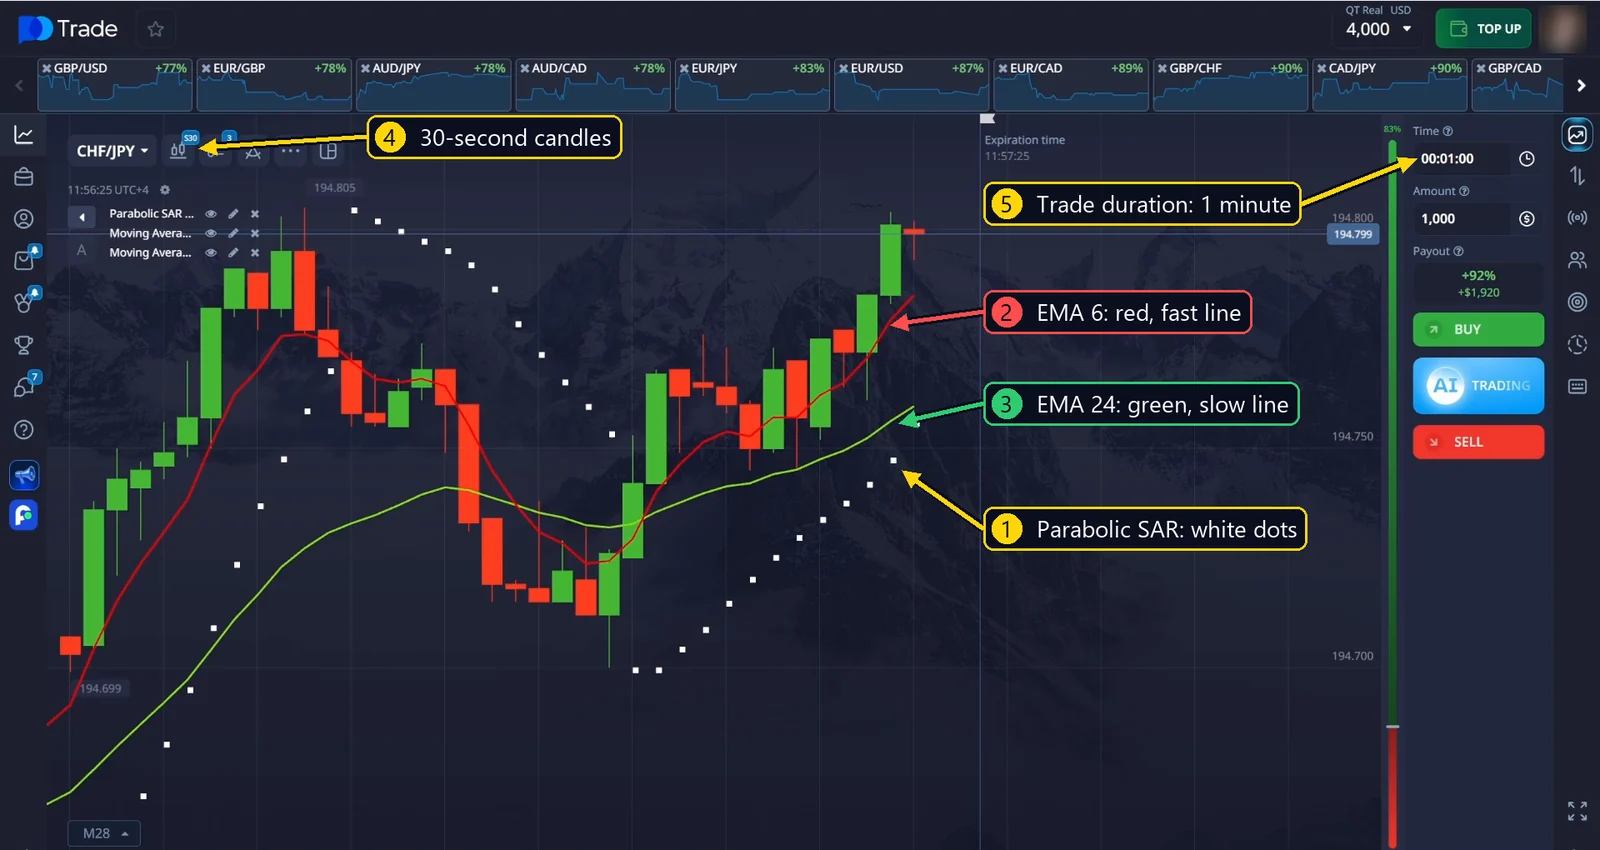
First, I add the Parabolic SAR to the chart. I change only one setting: I set Acceleration to 0.05. Maximum acceleration stays at its default (0.2). I choose white as the color and make the line thicker so the dots stand out clearly on the chart.
The second indicator is a Moving Average. I increase the period to 24, choose EMA as the type and make the line thicker. This is the slow, green line.
The third is another Moving Average. Since I want the two moving averages to work in combination, I give this one a short period: 6. The type is EMA here too, and the color is red. This is the fast line, and it reacts to price changes more quickly.
I use regular Japanese candlesticks on a 30-second timeframe. When I enter a trade, I set the duration to 1 minute. As for currency pairs, I always pick the one with the highest payout percentage at that moment.
| Indicator / setting | Value | Color |
|---|---|---|
| Parabolic SAR | Acceleration 0.05, Maximum 0.2 | White, thick |
| Moving Average (slow) | Period 24, EMA | Green, thick |
| Moving Average (fast) | Period 6, EMA | Red |
| Candles | 30 seconds | |
| Trade duration | 1 minute | |
| Currency pair | Highest payout % |
In this method, every indicator is equally important. There’s no “secondary” indicator that I added just to reinforce the signal. If even one of the three doesn’t confirm the signal, I don’t enter the trade.
2. Rule One: The Parabolic SAR “Golden Range” (3–7 Dots)
There’s one detail about the white Parabolic SAR dots that I always take into account when opening a position. It’s thanks to this detail that I get much better results with this method.
When the dots line up above the price, the signal is down. When they line up below the price, the signal is up. There must be at least 3 dots in a row in the new direction, and at the moment I open the position, there should be no more than 7. In short, 3 to 7 dots is the “golden range” of this method.
There’s one more important detail: the fewer dots there are, the stronger the signal. For example, if only 3 dots are giving the signal, it’s considered relatively stronger than a signal with 6 or 7 dots. The logic is simple: a few dots mean the move has only just started and still has room to run. With many dots, the trend is already “tired”, and the chance of a reversal goes up.
3. Rule Two: A Fresh Moving Average Crossover
The red and green moving averages play one of the most decisive roles in this method. I always try to open a position when these two lines have just crossed:
- when the red EMA 6 crosses the green EMA 24 from below to above, that’s a BUY signal;
- when the red EMA 6 crosses the green EMA 24 from above to below, that’s a SELL signal.
This detail works perfectly together with the Parabolic SAR dots. If there’s no fresh crossover in a given direction, meaning the lines crossed a long time ago or haven’t crossed at all, I simply don’t open a position.
4. Rule Three: Look at the Candles Themselves
Besides the indicators, I always watch how the price is moving. If there are already several strong candles in the direction of the signal (for example, three big red candles in a row going down), that’s extra confirmation. On the other hand, when the candles are moving very fast and jumping around, I avoid opening a position: at times like that, it’s easy to enter at a bad point. You’ll see an example of this below, in the third trade.
Quick Entry Checklist
| BUY (up) | SELL (down) | |
|---|---|---|
| Parabolic SAR | 3–7 dots below the price | 3–7 dots above the price |
| EMA 6 / EMA 24 | Red has just crossed above green | Red has just crossed below green |
| Candles | Green candles, without overly fast jumps | Red candles, without overly fast jumps |
| Duration | 1 minute | 1 minute |
5. Five Real Entries: Why I Entered Each Trade
Each screenshot below has numbered arrows, and the explanation under the image uses the same numbers. Every screenshot was taken at the exact moment of entry, right before I clicked the button.
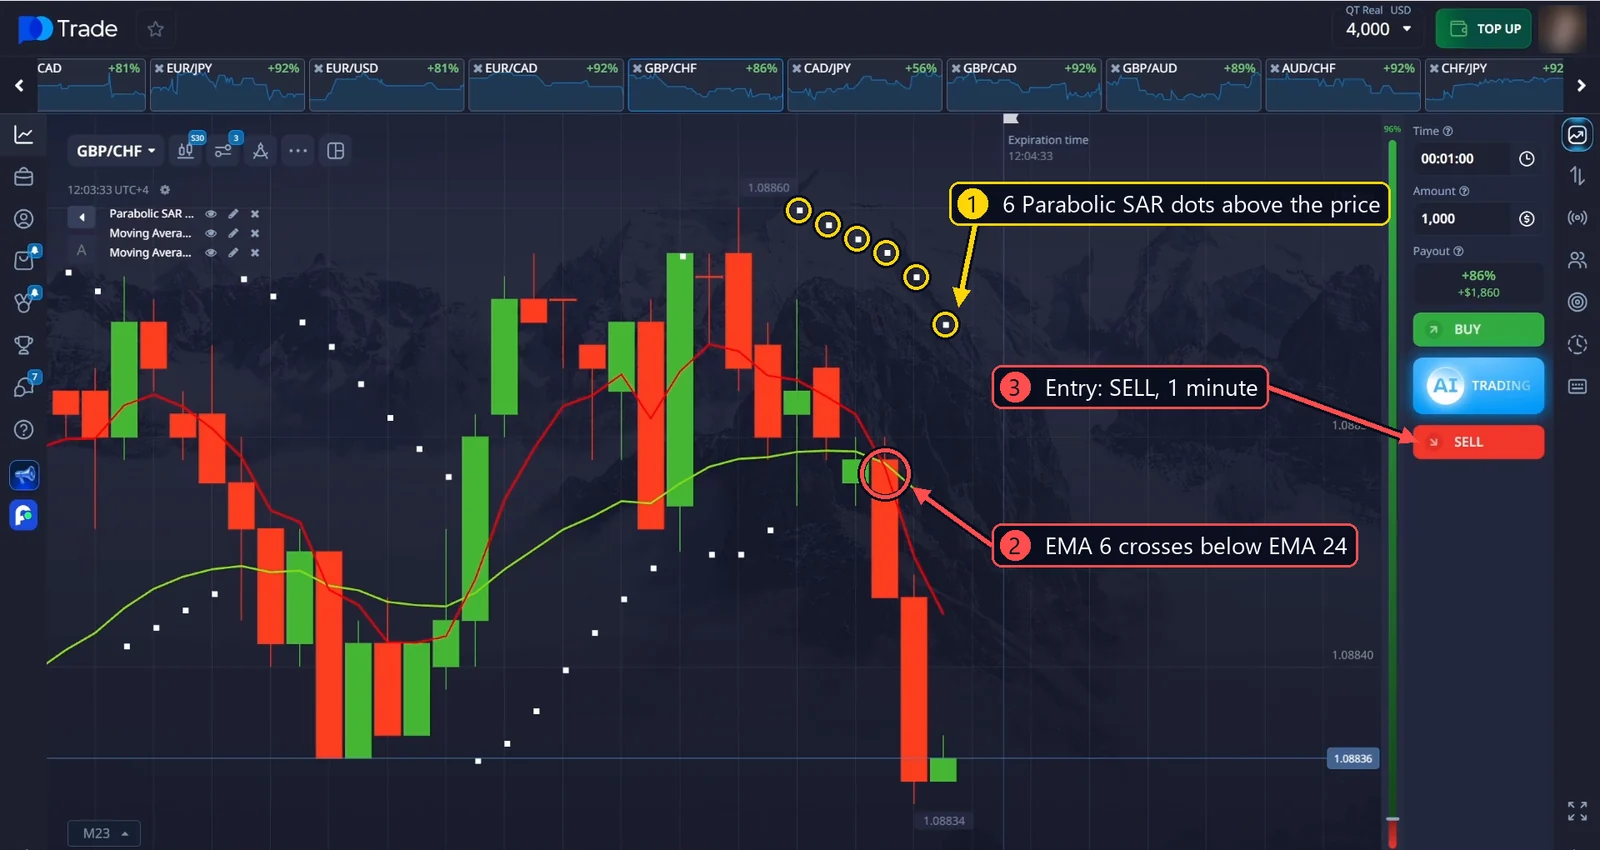
Trade #1: GBP/CHF, SELL
In the video: 2:00 · Entry 12:03:33 · Payout 86%
Why I entered:
- The Parabolic SAR dots moved above the price, and 6 dots formed in a row. That’s still within the 3–7 range, so the downward signal is valid.
- The red EMA 6 has just crossed the green EMA 24 from above to below. Both indicators point in the same direction.
- The last red candle is big and strong, and the price is clearly heading down. I open a SELL for 1 minute.
Result: I opened 4 positions on this signal, $1,000 each. All four closed in profit, and I got back $7,440 in total. This was the first win in the video.
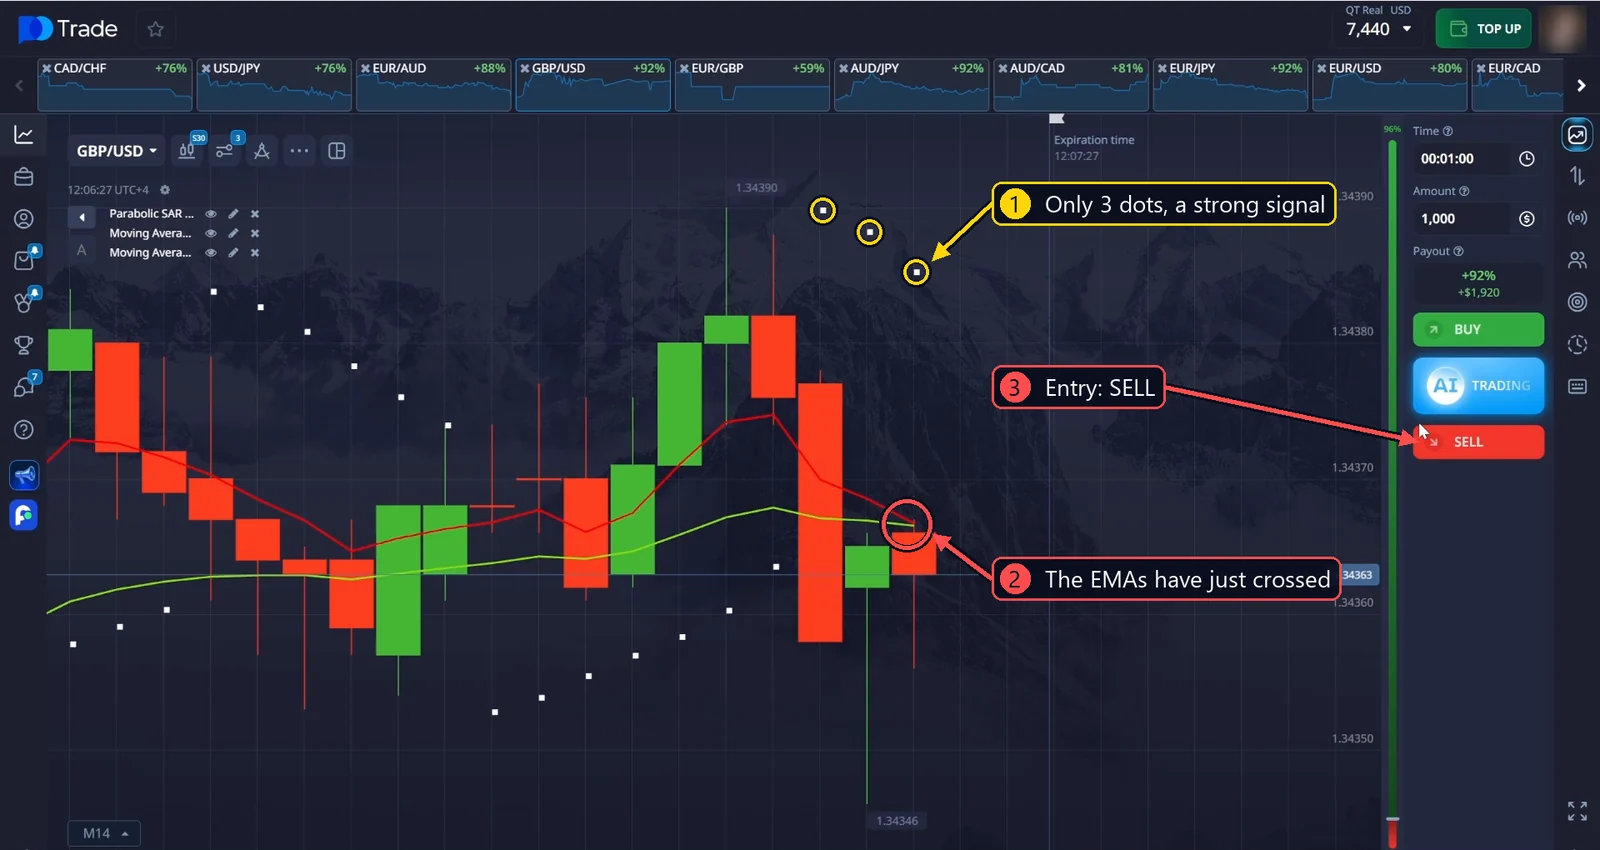
Trade #2: GBP/USD, SELL
In the video: 2:57 · Entry 12:06:27 · Payout 92%
Why I entered:
- There are only 3 Parabolic SAR dots above the price. In the video, by the time I talk about this trade, the platform already shows 4 dots, but there were three when I opened the position. This is the strongest variant: the fewer the dots, the stronger the signal.
- The red and green EMAs have just met on the last candle and crossed downward.
- Both conditions confirm the downward direction, so I open a SELL.
Result: 3 positions closed in profit: a total payout of $5,760 and a net profit of $2,760.
Trade #3: USD/CHF, BUY (a lesson)
In the video: 3:57 · Entry 12:12:37 · Payout 76%
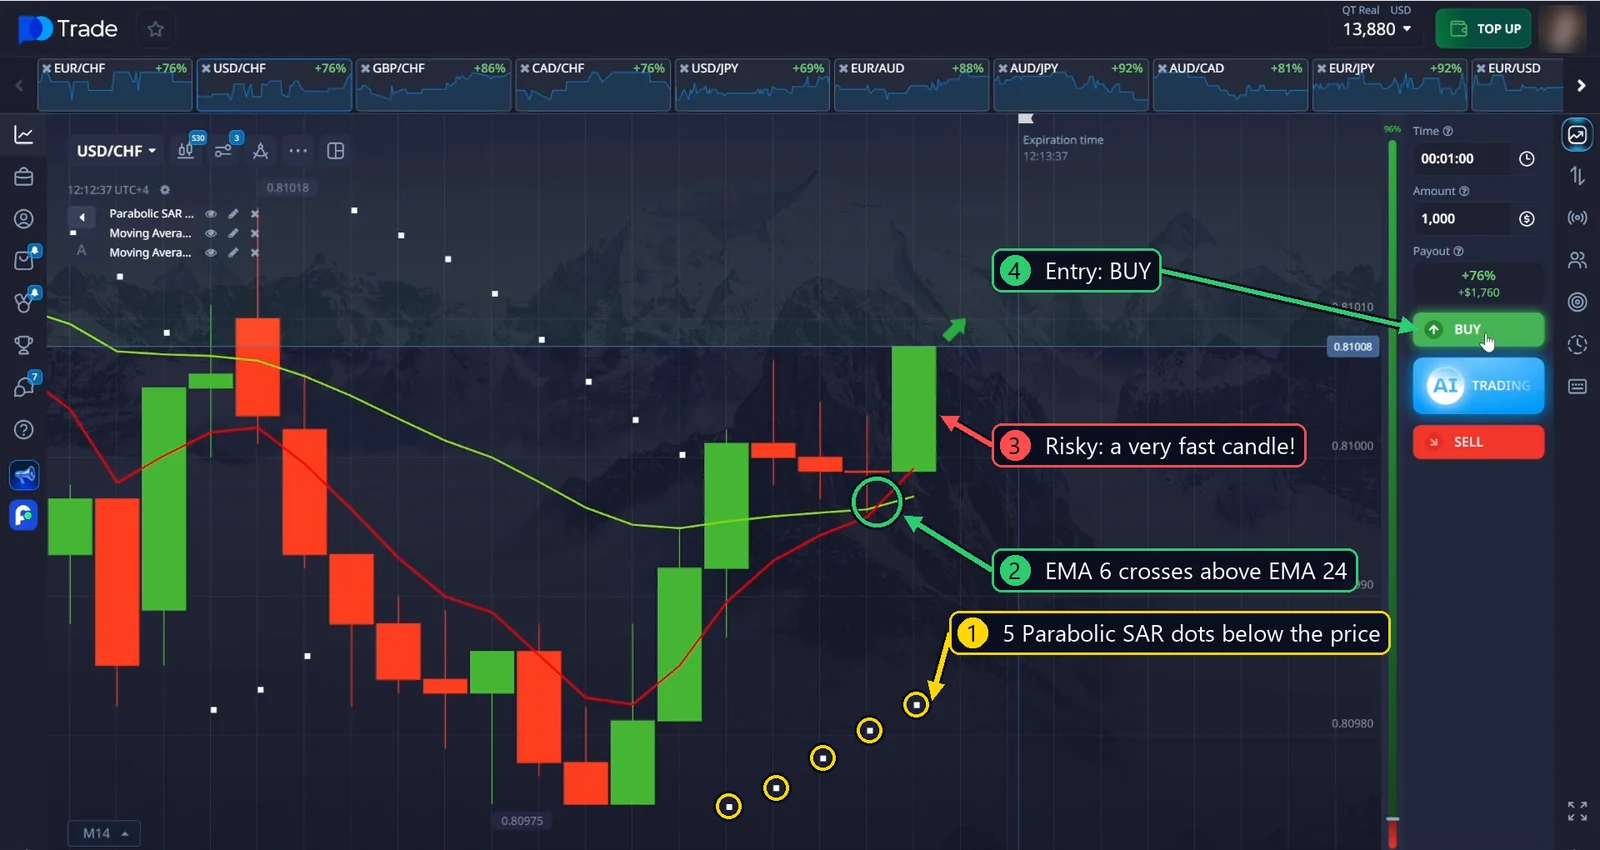
Why I entered:
- There are 5 Parabolic SAR dots below the price. The signal is up and within the range.
- The red EMA 6 crossed the green EMA 24 from below to above, so the indicators are giving a good signal.
- But I made a mistake here: the last green candle was very big and fast. One second after I entered, the candle dropped sharply, which means I entered at a bad point.
- I opened the position as a BUY.
Result: I lost part of the amount, but I avoided losing all of it and kept part of it in a profitable position. Things like this happen sometimes, and that’s okay. The takeaway is this: when the candles are moving very fast, I don’t open a position, no matter how good the indicator signal looks.
Trade #4: AUD/CAD, BUY
In the video: 5:00 · Entry 12:19:19 · Payout 81%
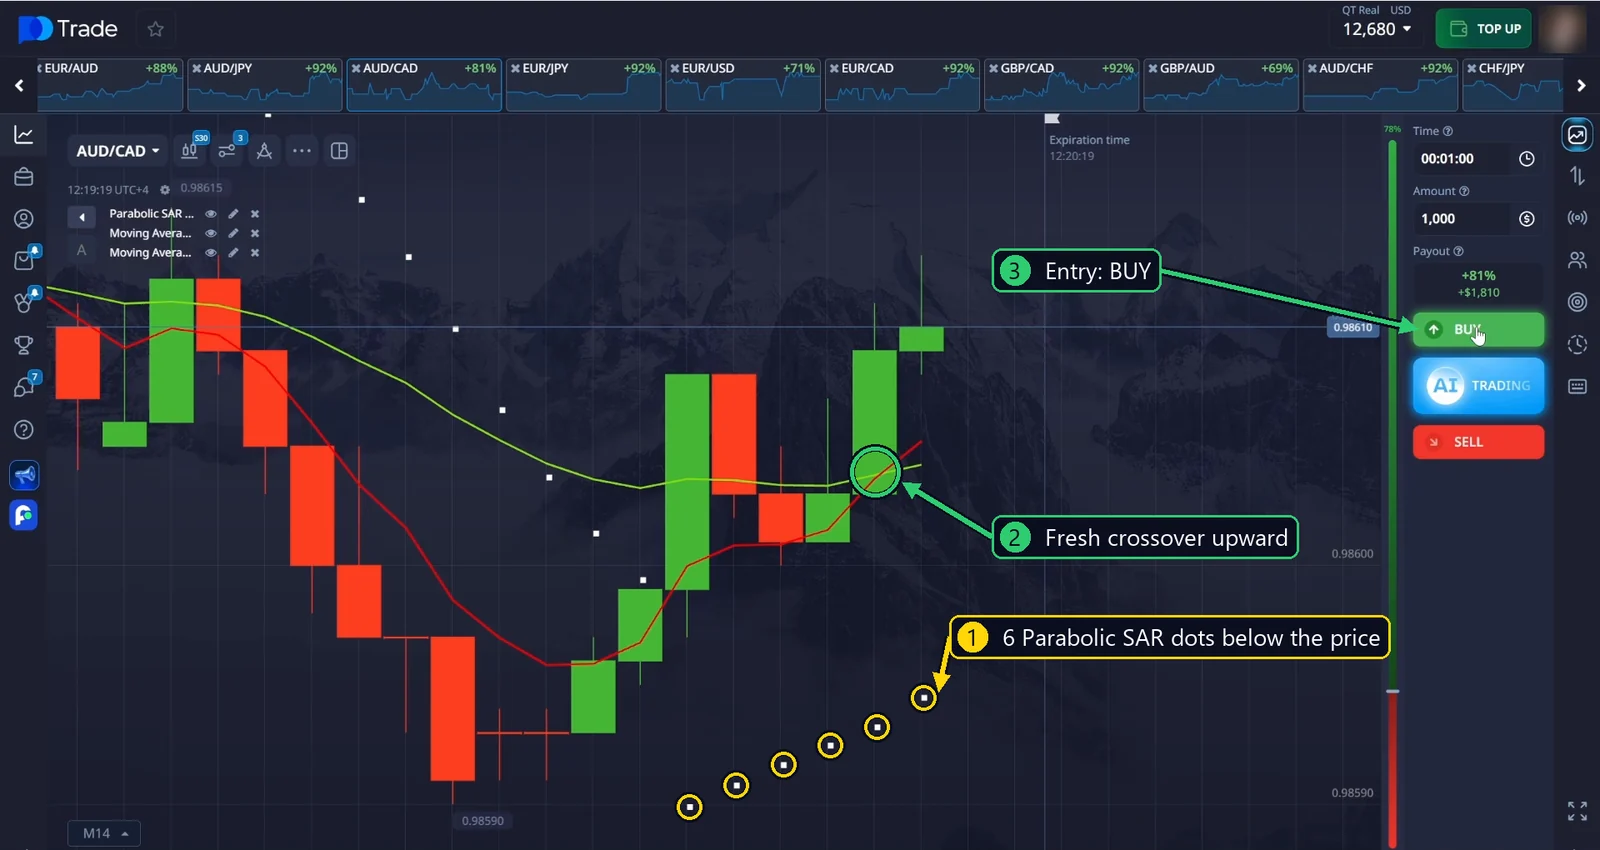
Why I entered:
- There are 6 Parabolic SAR dots below the price. The signal is up and still within the 3–7 range.
- The red EMA 6 has just crossed the green EMA 24 from below to above. This is exactly the moment I like to open a position: the crossover is fresh, and it works together with the Parabolic SAR dots.
- I open a BUY on a different currency pair, for 1 minute.
Result: A pretty convincing win: 4 positions closed, with a total payout of $7,240 and a net profit of $3,240.
Trade #5: CAD/CHF, SELL (the best setup for this method)
In the video: 6:00 · Entry 12:28:02 · Payout 76%
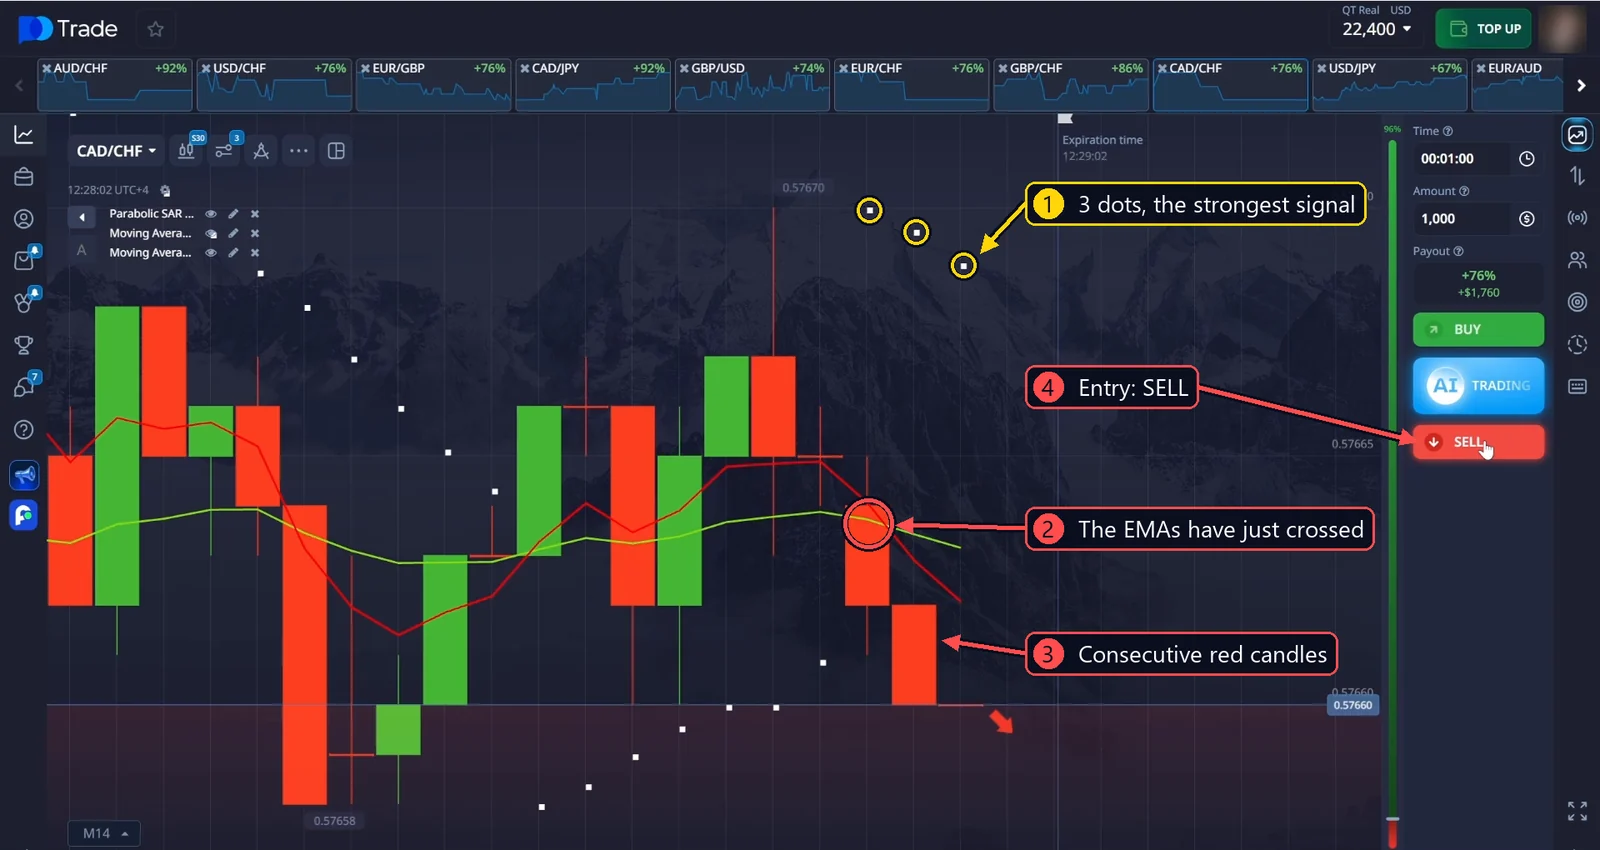
I call this the best setup for this method, because every factor lines up perfectly at the same time.
Why I entered:
- There are only 3 Parabolic SAR dots above the price. That’s a strong downward signal, and I’ve already explained why above.
- The red and green EMAs have just crossed downward.
- Even without the indicators, you can see three strong red candles in a row heading down, and the fourth is starting to move down too.
- All three factors point in the same direction. I open a SELL.
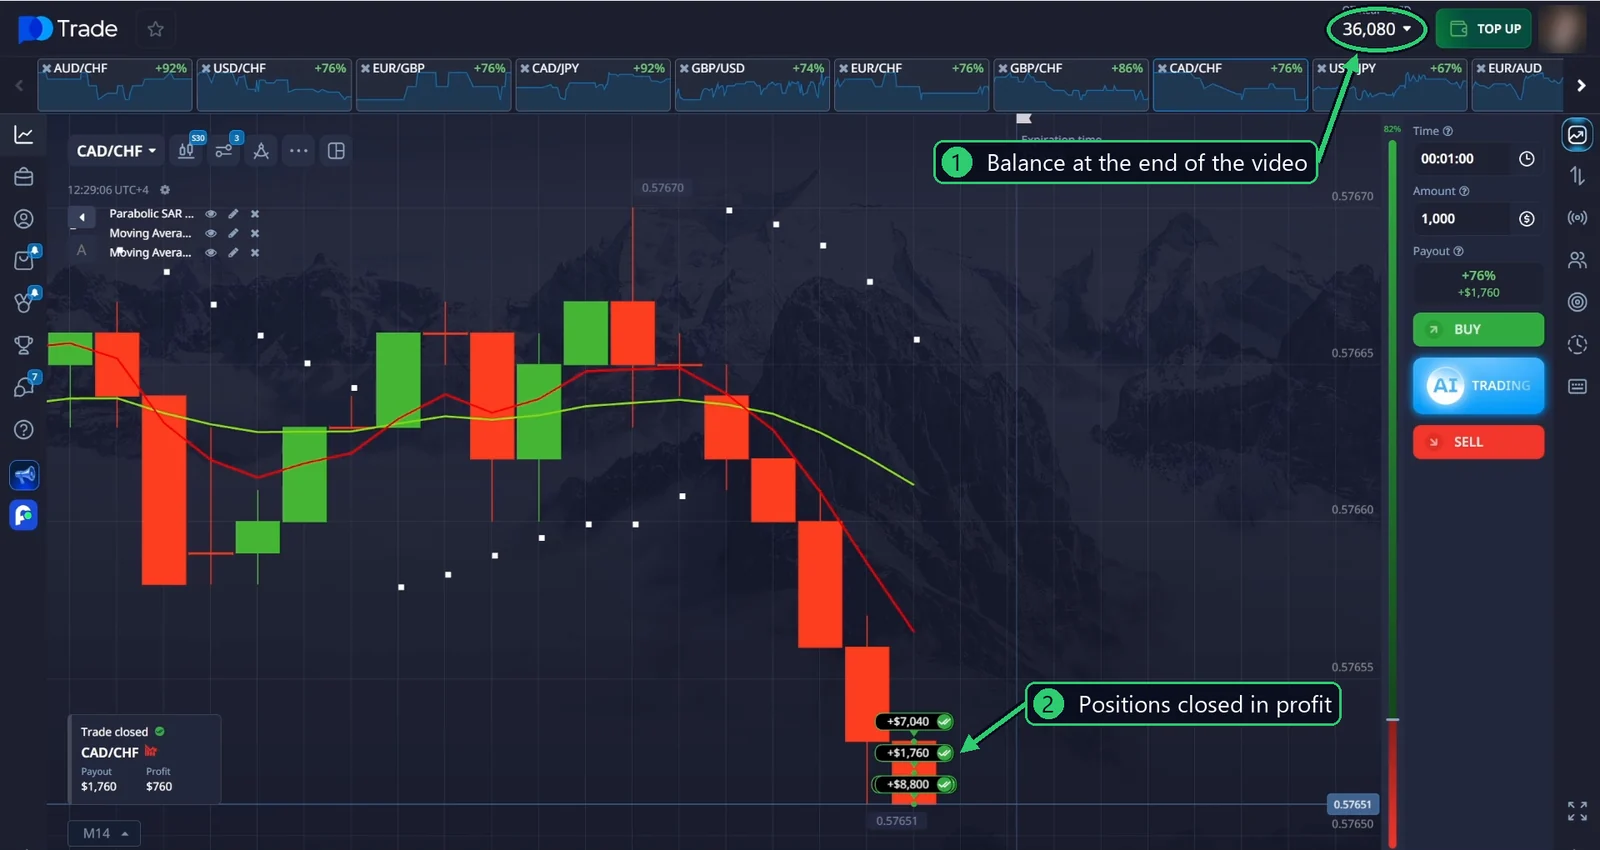
Result: I won this trade very convincingly. In situations like this, I often close my trades successfully. All positions closed in profit, and the balance grew to $36,080.
6. Tips and Common Mistakes
- More than 7 Parabolic SAR dots means you’re too late. The trend has been running for a long time, and the risk of a reversal is growing.
- Don’t enter based on a single indicator. The Parabolic SAR and the EMA crossover must point in the same direction.
- An old crossover isn’t a signal. Only pay attention to one that has just happened.
- Don’t enter on very fast candles. Wait for the market to calm down. The third trade is a good example of this.
- Choose pairs with a high payout. The same signal will earn you more at a higher percentage.
- Practice on a demo account first. Before you put in real money, test the method on a demo account for a few days, and risk only a small part of your balance on each trade.
Conclusion
The method rests on three simple rules that complement each other: Parabolic SAR dots within the 3–7 range (the fewer, the better), a fresh crossover of the EMA 6 and EMA 24 in the same direction, and calm candles moving one way. When all three line up, the signal is strong. If even one is missing, I skip the trade and wait for the next opportunity.
I hope I’ve explained everything clearly. In the next article, I’ll share another similar method that also works well across different markets. I wish you successful trading days!
Watch the full video
I’m Katie. I’ve been trading for more than seven years, and most of my own trading is short-term options like the trades above. More about me.
Remember: trading involves risk. This article is for educational purposes only and is not a recommendation to copy my actions. You alone are responsible for all of your trading decisions.