Short-term trading is indeed risky business, compared to conventional investment. Short-term trading is usually prevalent for the CFD instruments and derivatives. This sort of trading allows the traders to buy and sell a position depending on their prediction.
Trading in a short time frame requires meticulous analysis and informative decision. Most of the time, you have such a limited time to reserve your opportunity and make profit. It is great for you to know how to analyze the charts if you are focusing on short-term trading. And here are the best ways to improve your short-term trading analysis.
Check on different chart time frames
As you analyze the particular market, it is ideal to get your attention to different chart time frames. Ones can easily miss opportunity in a smaller time frame of the chart. But when you zoom the time frames out, you will take on a bigger picture. in turn, you will be able to see the opportunity. But it can also work vice versa. As you have a bigger picture, there’s a possibility of missing a point in the time frames. Therefore, you’d like to zoom in to get the details of the available opportunities. It is a great idea to evaluate an asset on different time frames since it will help you understand more about the trend and lead you to the informative decision.
For instance, you will want to evaluate a stock chart on three different time frames: 30 minutes, 2 and 4 hours. If you take a look at the short-term conditions, you could use the combination of the SMA and RSI to see the trend of the particular stock.
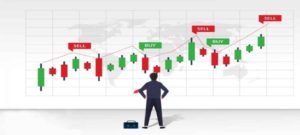
From those time frames, you will be able to find the opportunity to decide the Buy position and continue with the trend until the bearish reversal takes place.
See the chart patterns
In order to do effective technical analysis, it is necessary to conduct extensive research on chart patterns. While chart patterns appear, traders should keep a watch out for major market phases such as upward and downward movement, as well as a sideways trend, when trading the market.
All traders should be familiar with the reversal and continuation patterns that may be found in candlestick charts. Despite the fact that it may be advisable to double-check the patterns’ signals, they may prove to be effective indications of what to expect from the market in the long term.
Choosing the best indicators
However, you may be able to enhance your strategy by learning how to tailor an indicator to your specific period and market conditions. But which settings should I use?
The indicator is more sensitive with smaller settings, but the indicator is less sensitive with larger settings, resulting in more accurate indications (but this does not imply they are 100 percent true). When using the RSI indicator in this manner, the normal values of 70/30 or 80/20 can be used. Indicators with larger settings, on the other hand, may lag.
Customizing an indicator to your trading style is all that matters in the end.
Making an informative decision
Traders who deal in short-term contracts must make rapid decisions. When judgments must be made quickly, overthinking may be deadly. You’ll miss out if you don’t seize every chance that comes your way. An effective short-term trading strategy requires planning ahead of time and refraining from making rash judgments.
Short-term trading requires a different strategy than long-term investment. To enhance your short-term market analysis, look for candlestick patterns and make modifications to your indicators. Making rapid judgments is essential in short-term trading, and any trader who wishes to specialize in it must learn how to do it.